. 2013 Jul 24:10:47.
doi: 10.1186/1742-4682-10-47.

Mathematical modelling of spatio-temporal glioma evolution

Affiliations

Mathematical modelling of spatio-temporal glioma evolution

Maria Papadogiorgaki et al. Theor Biol Med Model. .

Abstract

Background: Gliomas are the most common types of brain cancer, well known for their aggressive proliferation and the invasive behavior leading to a high mortality rate. Several mathematical models have been developed for identifying the interactions between glioma cells and tissue microenvironment, which play an important role in the mechanism of the tumor formation and progression.

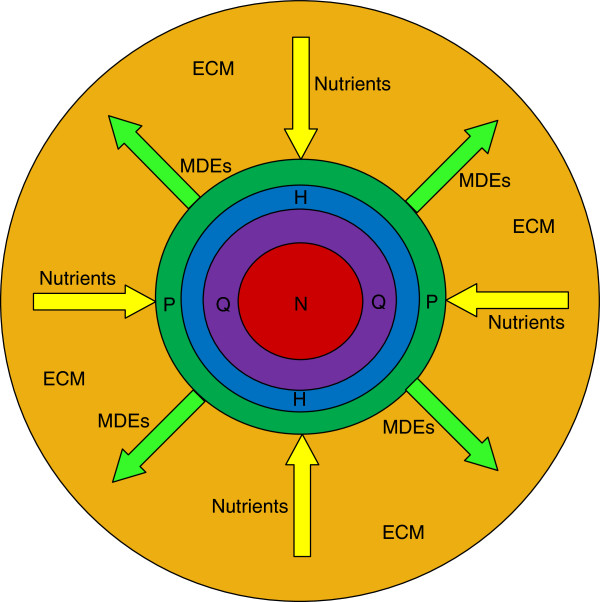
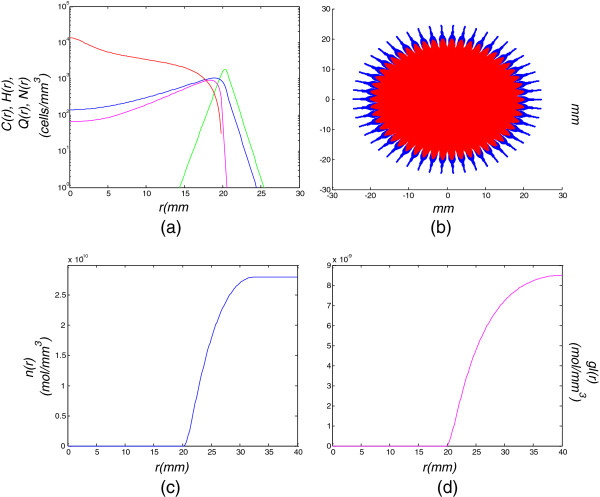
Methods: Building and expanding on existing approaches, this paper develops a continuous three-dimensional model of avascular glioma spatio-temporal evolution. The proposed spherical model incorporates the interactions between the populations of four different glioma cell phenotypes (proliferative, hypoxic, hypoglychemic and necrotic) and their tissue microenvironment, in order to investigate how they affect tumor growth and invasion in an isotropic and homogeneous medium. The model includes two key variables involved in the proliferation and invasion processes of cancer cells; i.e. the extracellular matrix and the matrix-degradative enzymes concentrations inside the tumor and its surroundings. Additionally, the proposed model focuses on innovative features, such as the separate and independent impact of two vital nutrients, namely oxygen and glucose, in tumor growth, leading to the formation of cell populations with different metabolic profiles. The model implementation takes under consideration the variations of particular factors, such as the local cell proliferation rate, the variable conversion rates of cells from one category to another and the nutrient-dependent thresholds of conversion. All model variables (cell densities, ingredients concentrations) are continuous and described by reaction-diffusion equations.

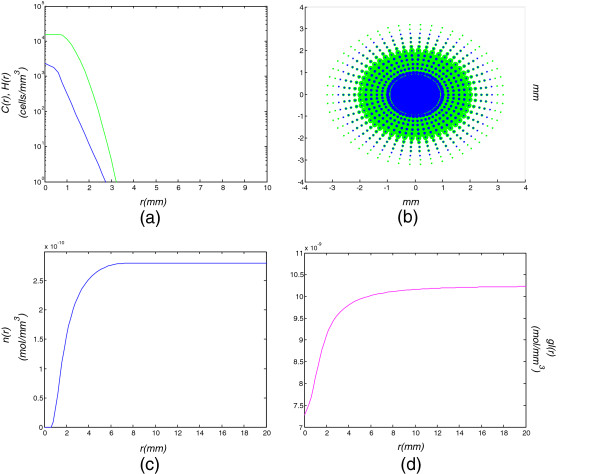
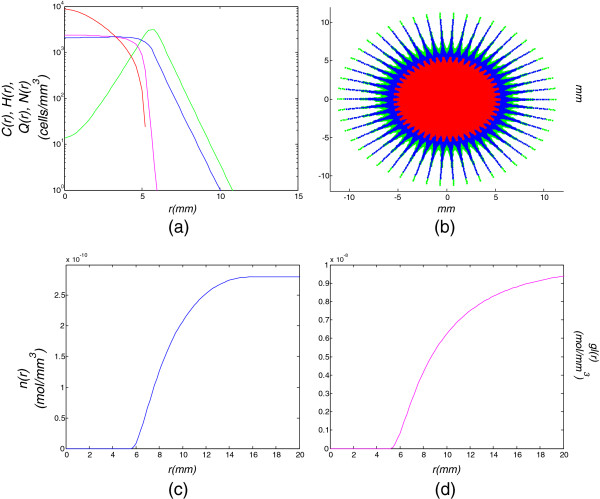
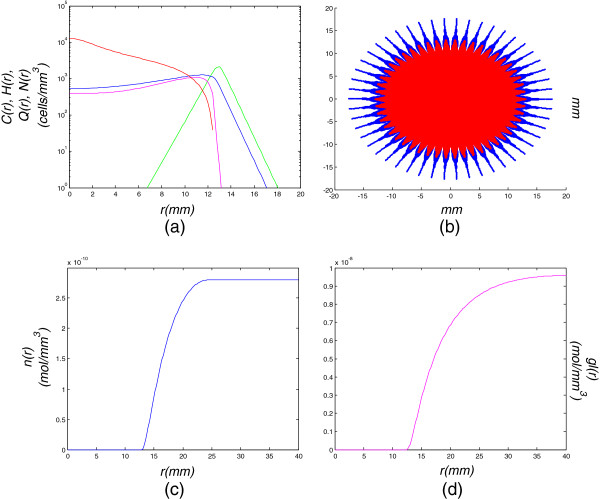
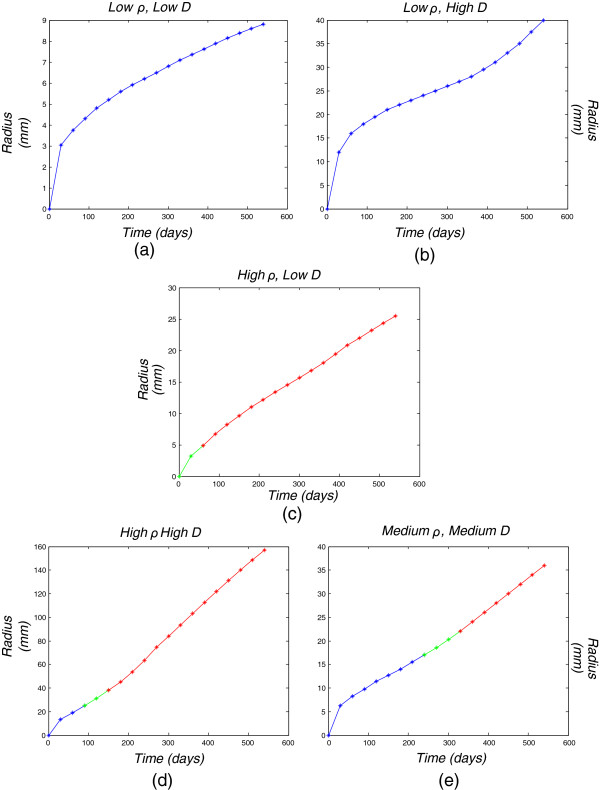
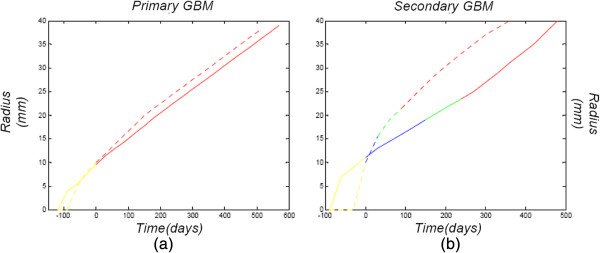
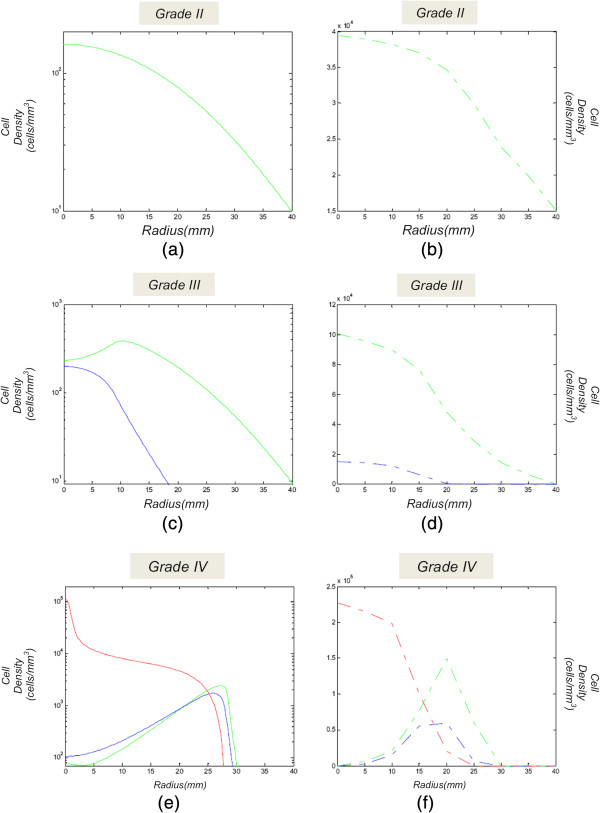
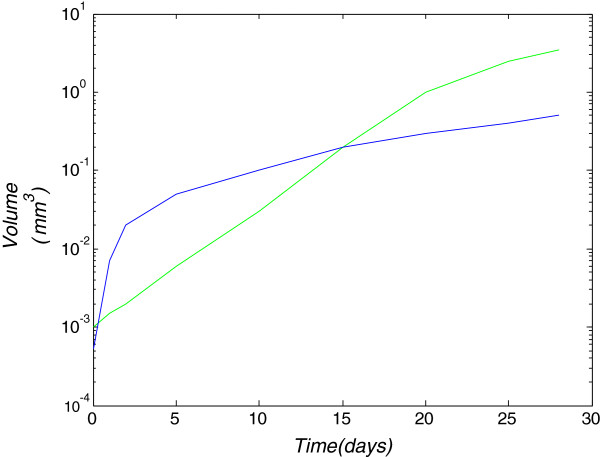
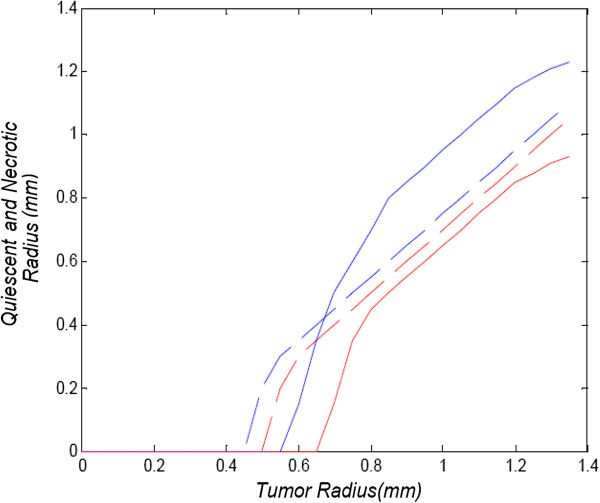
Results: Several simulations were performed using combinations of growth and invasion rates, for different evolution times. The model results were evaluated by medical experts and validated on experimental glioma models available in the literature, revealing high agreement between simulated and experimental results.

Conclusions: Based on the experimental validation, as well as the evaluation by clinical experts, the proposed model may provide an essential tool for the patient-specific simulation of different tumor evolution scenarios and reliable prognosis of glioma spatio-temporal progression.


Figures

Figure 1
Figure 1
Tumor regions in avascular evolution. Tumor regions in avascular evolution, where P is the Proliferative, H is the Hypoxic, Q is the Hypoglycemic and N is the Necrotic zone.
Figure 2
Figure 2
Model simulation of a low diffusion-high proliferation tumor for 30 days (1 month). Model simulation of a low diffusion-high proliferation tumor for 30 days (1 month): (a) cell density with respect to the tumor radius, (b) tumor cells dispersal in a 2D section, (c) oxygen and (d) glucose concentrations with respect to the tumor radius.
Figure 3
Figure 3
Model simulation of a low diffusion-high proliferation tumor for 180 days (6 months). Model simulation of a low diffusion-high proliferation tumor for 180 days (6 months): (a) cell density with respect to the tumor radius, (b) tumor cells dispersal in a 2D section, (c) oxygen and (d) glucose concentrations with respect to the tumor radius.
Figure 4
Figure 4
Model simulation of a low diffusion-high proliferation tumor for 360 days (12 months). Model simulation of a low diffusion-high proliferation tumor for 360 days (12 months): (a) cell density with respect to the tumor radius, (b) tumor cells dispersal in a 2D section, (c) oxygen and (d) glucose concentrations with respect to the tumor radius.
Figure 5
Figure 5
Model simulation of a low diffusion-high proliferation tumor for 540 days (18 months). Model simulation of a low diffusion-high proliferation tumor for 540 days (18 months): (a) cell density with respect to the tumor radius, (b) tumor cells dispersal in a 2D section, (c) oxygen and (d) glucose concentrations with respect to the tumor radius.
Figure 6
Figure 6
Glioma grade as a function of tumor size and time. Tumor grade as a function of tumor size and time for each of the five diffusion-proliferation (Dρ) combinations: (a) low diffusion-low proliferation, (b) high diffusion-low proliferation, (c) low diffusion-high proliferation, (d) high diffusion-high proliferation, (e) medium diffusion-medium proliferation. Blue part: grade II radius, green part: grade III radius, red part: Grade IV radius.
Figure 7
Figure 7
Glioma grade as a function of tumor size and time in comparison to [3] results. Tumor grade as a function of tumor size and time in comparison to results of [3] for two different diffusion-proliferation pairs. (a) corresponds to a primary glioblastoma produced by D=0.01 mm2/day, ρ=0.033/day, (b) illustrates a secondary (progressive from lower grade) glioblastoma produced by D=0.06 mm2/day, ρ=0.013/day. The dotted curves correspond to comparative results of [3]. Yellow part: minimum T2 detectable radius, blue part: grade II radius, green part: grade III radius, red part: grade IV radius.
Figure 8
Figure 8
Glioma grades represented as a plot of cell density for the different cell populations. Simulations of each grade of glioma represented as a plot of cell density for the different cell population (normoxic, hypoxic and necrotic) with respect to the distance from the center of the tumor. Green curve: normoxic cells, blue curve: hypoxic cells, red curve: necrotic cells. (a), (c) and (e): proposed model produced by different diffusion-proliferation pairs, (b), (d) and (f): comparable results of [3].
Figure 9
Figure 9
Tumor volume expansion in respect to time. Tumor volume expansion in respect to time. Green curve: experimental results of [1], blue curve: proposed model.
Figure 10
Figure 10
Quiescent and necrotic radius in respect to different tumour radius. Quiescent and necrotic radius in respect to different tumour radius. Blue curve: quiescent radius of proposed model, red curve: necrotic radius of proposed model, blue and red dashed curves: corresponding experimental results of [1].

References

    1. Kiran KL, Jayachandran D, Lakshminarayanan S. Mathematical modelling of avascular tumour growth based on diffusion of nutrients and its validation. Can J Chem Eng. 2009;87:732–740. doi: 10.1002/cjce.20204. - DOI
    1. Szeto MD, Chakraborty G, Hadley J. Quantitative metrics of net proliferation and invasion link biological aggressiveness assessed by MRI with hypoxia assessed by FMISO-PET in newly diagnosed glioblastomas. Cancer Res. 2009;69(10):4502–4509. doi: 10.1158/0008-5472.CAN-08-3884. - DOI - PMC - PubMed
    1. Swanson KR, Rockne RC, Claridge J, Chaplain MA, Alvord Jr EC, Anderson ARA. Quantifying the role of angiogenesis in malignant progression of gliomas: In Silico modeling integrates imaging and histology. Int Sys Tech: Math Onc Cancer Res. 2011;71(24):7366–7375. - PMC - PubMed
    1. Swanson KR, Bridgea C, Murray JD, Alvord EC. Virtual and real brain tumors: using mathematical modeling to quantify glioma growth and invasion. J Neurol Sc. 2003;216:1–10. doi: 10.1016/j.jns.2003.06.001. - DOI - PubMed
    1. Clatz O, Sermesant M, Bondiau PY, Delingette H, Warfield SK, Malandain G, Ayache N. Realistic simulation of the 3D growth of brain tumors in MR images coupling diffusion with biomechanical deformation. IEEE Trans Med Imag. 2005;24(10):1334–1346. - PMC - PubMed

Publication types