. 2013;5(8):1535-54.
doi: 10.1093/gbe/evt112.

Structure, transcription, and variability of metazoan mitochondrial genome: perspectives from an unusual mitochondrial inheritance system

Affiliations

Structure, transcription, and variability of metazoan mitochondrial genome: perspectives from an unusual mitochondrial inheritance system

Fabrizio Ghiselli et al. Genome Biol Evol. 2013.

Abstract

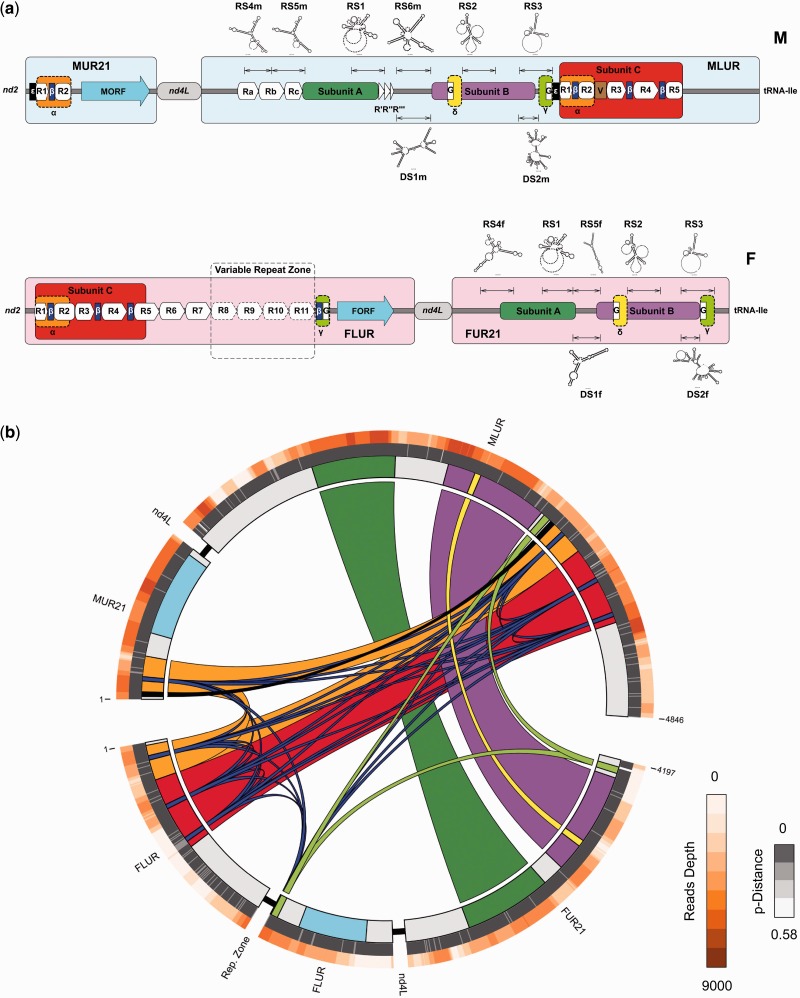
Despite its functional conservation, the mitochondrial genome (mtDNA) presents strikingly different features among eukaryotes, such as size, rearrangements, and amount of intergenic regions. Nonadaptive processes such as random genetic drift and mutation rate play a fundamental role in shaping mtDNA: the mitochondrial bottleneck and the number of germ line replications are critical factors, and different patterns of germ line differentiation could be responsible for the mtDNA diversity observed in eukaryotes. Among metazoan, bivalve mollusc mtDNAs show unusual features, like hypervariable gene arrangements, high mutation rates, large amount of intergenic regions, and, in some species, an unique inheritance system, the doubly uniparental inheritance (DUI). The DUI system offers the possibility to study the evolutionary dynamics of mtDNAs that, despite being in the same organism, experience different genetic drift and selective pressures. We used the DUI species Ruditapes philippinarum to study intergenic mtDNA functions, mitochondrial transcription, and polymorphism in gonads. We observed: 1) the presence of conserved functional elements and novel open reading frames (ORFs) that could explain the evolutionary persistence of intergenic regions and may be involved in DUI-specific features; 2) that mtDNA transcription is lineage-specific and independent from the nuclear background; and 3) that male-transmitted and female-transmitted mtDNAs have a similar amount of polymorphism but of different kinds, due to different population size and selection efficiency. Our results are consistent with the hypotheses that mtDNA evolution is strongly dependent on the dynamics of germ line formation, and that the establishment of a male-transmitted mtDNA lineage can increase male fitness through selection on sperm function.

Keywords: CORR; doubly uniparental inheritance; germ line mitochondria; mitochondrial intergenic regions; mitochondrial polymorphism; novel mitochondrial ORFs.


Figures

F<sc>ig</sc>. 1.—
Fig. 1.—
Features of Ruditapes philippinarum major URs. Main features of the largest URs in M- and F-type mtDNAs. (a) Conserved regions, motifs, repeated units and major secondary structures (both at DNA and RNA level). M, M-type mtDNA; F, F-type mtDNA; orange, motif α; turquoise, novel ORFs; dark green, subunit A; orchid, subunit B; red, subunit C; yellow, motif δ; light green, motif γ; black, motif ε; blue, motif β; G, G-homopolymer; Ra, Rb, Rc, R′, R″, R′′′, M-type-specific repeats; R1-R11, Repeats; V, variable length spacer. (b) Circos diagram of the LURs of M- and F-type mtDNA showing transcription depth (orange gradient) and nucleotidic variability (inter-lineage p-distance, gray gradient) of the largest URs. The ribbons link conserved region and motifs within and between major URs. Note.—M-type above, F-type below. From the outside to the inside: transcription level (orange gradient scale 0–9000), p-distance (gray gradient scale 0–0.58), subunits and motifs with links between M-type and F-type. Orange, Motif α; turquoise, novel ORFs; dark green, subunit A; orchid, subunit B; red, subunit C; yellow, motif δ; light green, motif γ; black, motif ε; blue, motif β.
F<sc>ig</sc>. 2.—
Fig. 2.—
Circos diagrams of M-type and F-type transcriptomes. Transcription depth and SNPs mapped to the Ruditapes philippinarum mitochondrial genomes (GenBank accession nos.: AB065374 and AB065375). Genes are colored according to ETC complexes: green, complex I; brown, complex III; red, complex IV; orange, complex V. Ribosomal genes are colored in yellow, URs in gray, MORF in purple, and tRNAs in white. Histograms represent reads depth of F-type mtDNA (light red) and M-type mtDNA (light blue); black lines scale 0–4[log10−1]. Dots represent SNP position and frequency in protein coding genes; black lines scale 0–1.
F<sc>ig</sc>. 3.—
Fig. 3.—
Transcription level of mitochondrial protein coding genes. (a) Transcription of M-type in males; (b) transcription of F-type in females; (c) transcription of F-type in males; and (d) transcription profiles (median values used). On the y axis is plotted the FPKM value. The lines that links the genes in (d) are virtual. Their purpose is to highlight the differences and similarities of transcription profiles. See table 3 for the correlation tests between mtDNA transcripts. In (d), the significance of Wilcoxon rank-sum test between M-type (M) and F-type in females (F) is reported below the x axis. *P < 0.05, **P < 0.01, ***P < 0.001, ns, nonsignificant; na, not applicable.
F<sc>ig</sc>. 4.—
Fig. 4.—
Transcription level of electron transport chain (ETC) genes. (a) Nuclear-encoded genes: black, male gonad; white, female gonad. (b) Mitocondrially encoded genes: black, M-type mtDNA; white, F-type mtDNA. I, III, IV, and V represents the ETC complexes: the analyzed genes and their accession numbers are enlisted in supplementary table S10–S13, Supplementary Material online. Complex II proteins are encoded only by nuclear genes, so they were not included in the analysis. On the y axis is plotted the FPKM value. Wilcoxon rank-sum test significance: *P < 0.05, **P < 0.01; ***P < 0.001.
F<sc>ig</sc>. 5.—
Fig. 5.—
Kernel density plot of allele frequencies in mitochondrial CDSs. Probability density function of allele frequencies calculated by kernel density estimation. Solid line: M-type mtDNA; dashed line: F-type mtDNA in female gonads. The two distributions are significantly different (Kolmogorov-Smirnov P = 0.0061): the F-type shows an excess of rare alleles (frequency < 0.125), while M-type has a pronounced peak around 0.5. The distribution in the Fm genome (not shown) is not statistically different from that in F.
F<sc>ig</sc>. 6.—
Fig. 6.—
Boxplots of SNP polymorphism and SNP effects in F (white), Fm (gray), and M (black) mitochondrial genomes. (a) number of SNPs normalized to coding sequence (CDS) length; (b) nonsynonymous (Ns) SNPs to total number of SNPs ratio (polyallelic SNPs only); (c) nonsynonymous (Ns) SNPs to total number of SNPs ratio (monoallelic SNPs only); (d) percentage of high-effect SNPs (polyallelic + monoallelic); (e) percentage of moderate-effect SNPs (polyallelic + monoallelic); (f) percentage of low-effect SNPs (polyallelic + monoallelic); (g) percentage of high-effect SNPs (monoallelic only); (h) percentage of moderate-effect SNPs (monoallelic only); (i) percentage of low-effect SNPs (monoallelic only). Note.—A Kruskal–Wallis nonparametric ANOVA was performed. Significance levels of post hoc multiple comparison tests are reported below the x axis of each plot. *P < 0.05, **P < 0.01, ***P < 0.001, ns, nonsignificant.

Similar articles

Cited by

References

    1. Abhishek A, Bavishi A, Bavishi A, Choudhary M. Bacterial genome chimaerism and the origin of mitochondria. Can J Microbiol. 2011;57:49–46. - PubMed
    1. Allen JF. Separate sexes and the mitochondrial theory of ageing. J Theor Biol. 1996;180:135–140. - PubMed
    1. Allen JF. The function of genomes in bioenergetic organelles. Philos Trans R Soc Lond B Biol Sci. 2003;358:19–37. - PMC - PubMed
    1. Allendorf FW. Genetic drift and the loss of alleles versus heterozygosity. Zool Biol. 1986;5:181–190.
    1. Andersson SG, Kurland CG. Reductive evolution of resident genomes. Trends Microbiol. 1998;6:263–268. - PubMed

Publication types

Substances

Associated data

LinkOut - more resources