. 2013 Jul 16:7:336.
doi: 10.3389/fnhum.2013.00336. eCollection 2013.

Optic ataxia as a model to investigate the role of the posterior parietal cortex in visually guided action: evidence from studies of patient M.H

Affiliations

Optic ataxia as a model to investigate the role of the posterior parietal cortex in visually guided action: evidence from studies of patient M.H

Cristiana Cavina-Pratesi et al. Front Hum Neurosci. .

Abstract

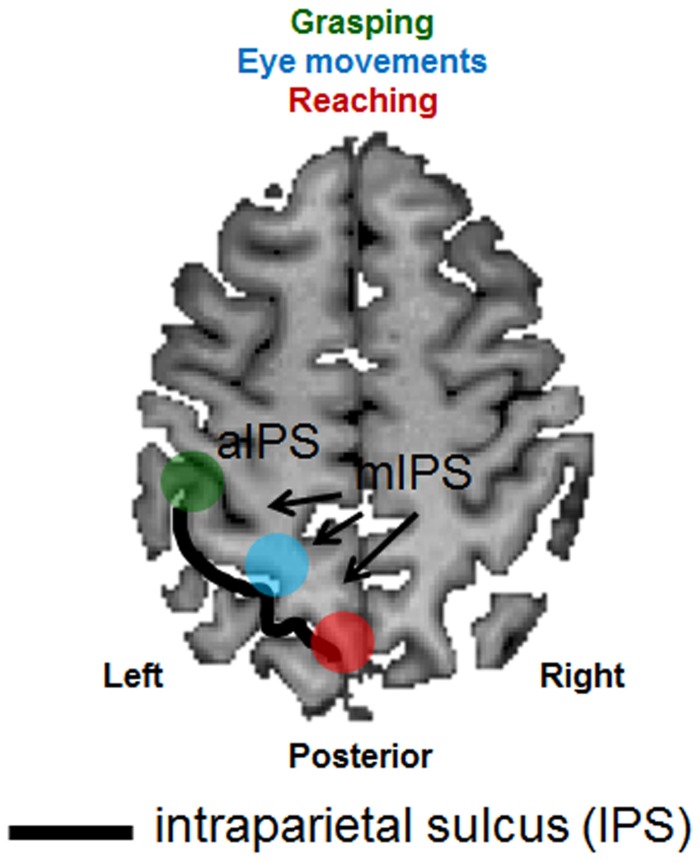
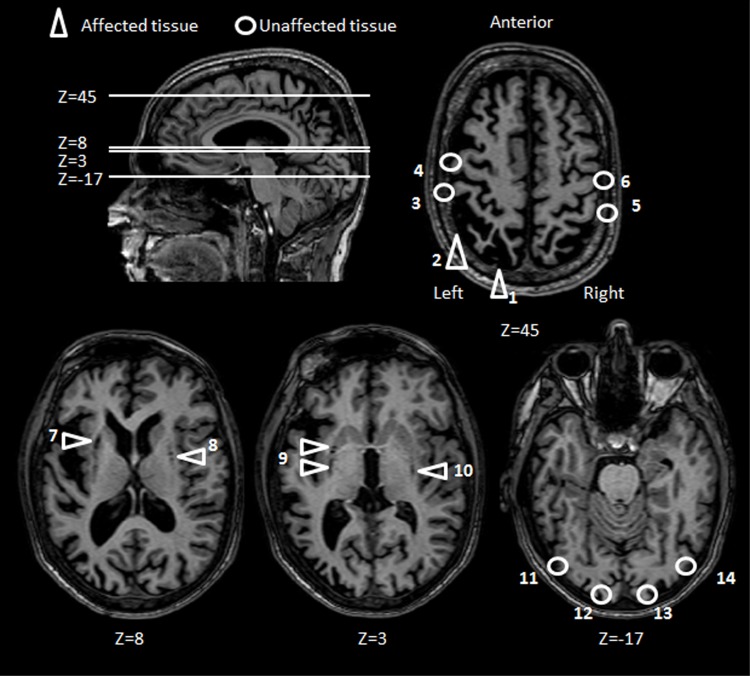
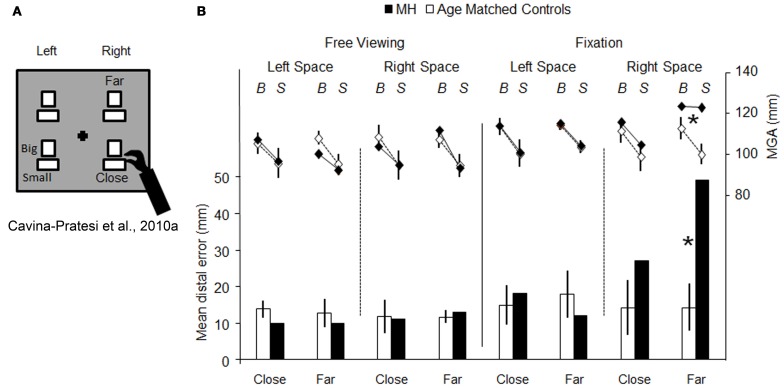
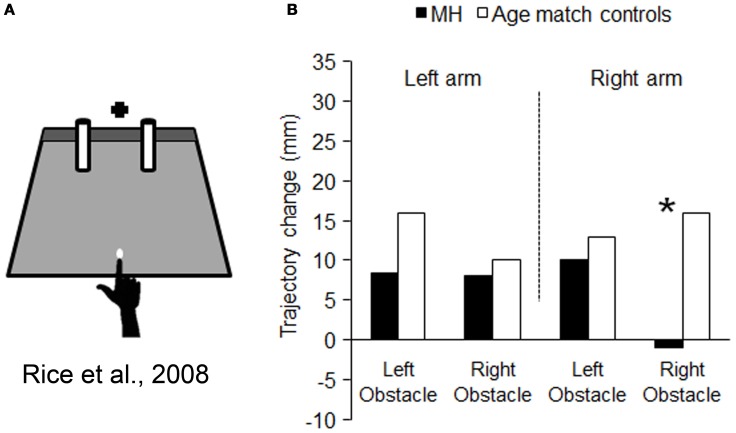
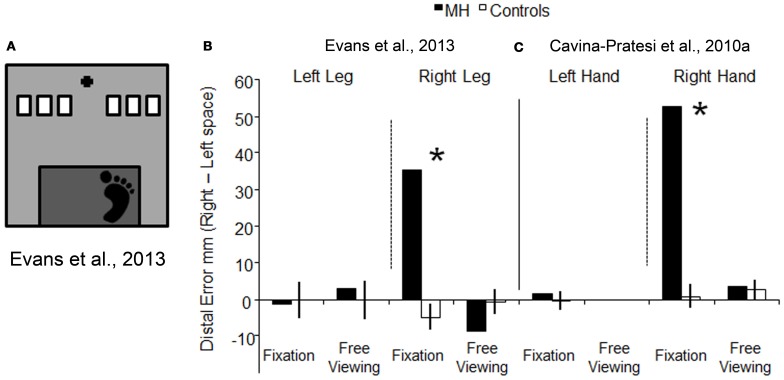
Optic ataxia is a neuropsychological disorder that affects the ability to interact with objects presented in the visual modality following either unilateral or bilateral lesions of the posterior parietal cortex (PPC). Patients with optic ataxia fail to reach accurately for objects, particularly when they are presented in peripheral vision. The present review will focus on a series of experiments performed on patient M.H. Following a lesion restricted largely to the left PPC, he developed mis-reaching behavior when using his contralesional right arm for movements directed toward the contralesional (right) visual half-field. Given the clear-cut specificity of this patient's deficit, whereby reaching actions are essentially spared when executed toward his ipsilateral space or when using his left arm, M.H. provides a valuable "experiment of nature" for investigating the role of the PPC in performing different visually guided actions. In order to address this, we used kinematic measurement techniques to investigate M.H.'s reaching and grasping behavior in various tasks. Our experiments support the idea that optic ataxia is highly function-specific: it affects a specific sub-category of visually guided actions (reaching but not grasping), regardless of their specific end goal (both reaching toward an object and reaching to avoid an obstacle); and finally, is independent of the limb used to perform the action (whether the arm or the leg). Critically, these results are congruent with recent functional MRI experiments in neurologically intact subjects which suggest that the PPC is organized in a function-specific, rather than effector-specific, manner with different sub-portions of its mantle devoted to guiding actions according to their specific end-goal (reaching, grasping, or looking), rather than according to the effector used to perform them (leg, arm, hand, or eyes).

Keywords: arm; grasping; hand; leg; optic ataxia; posterior parietal cortex; reaching.


Figures

Figure 1
Figure 1
Schematic representation of the anatomical and functional organization of the posterior parietal cortex. An axial (horizontal) slice through the brain of a healthy individual has been chosen to depict the major sulcus within the posterior parietal cortex, the intraparietal sulcus (IPS—outlined by the use of a black line). Functional areas selective for grasping (depicted in green), reaching (depicted in red) and eye movements (depicted in light blue) have been superimposed. aIPS, anterior IPS; mIPS, medial IPS.
Figure 2
Figure 2
Patient M.H.: axial brain slices. Key areas of M.H.'s brain have been highlighted according to whether the tissue has been either affected (triangles) or left unaffected (circles) by the anoxic accident. The position of each axial slice is shown by reference to a sagittal view of M.H. brain. Areas affected by the lesion include the left PPC (1, 2), and subcortical structures (7–10). Key sensorimotor and visual areas that have been spared by the lesions include bilateral post central (3, 5), central gyri (4, 6) bilateral striate (12, 13) and extrastriate visual cortices (11, 14).
Figure 3
Figure 3
Schematic representation of the set-up used for testing reaching vs. grasping behavior, and the results obtained. (A) is a schematic representation of the set-up used by (Cavina-Pratesi et al., 2010a). The black cross depicts the fixation point and the white rectangles show the possible target locations (only one target at a time was presented) and the possible sizes of the objects to be grasped (“Big” and “Small”). Patient M.H. and age-matched controls were asked to grasp objects that could be located either close to the hand (i.e., did not require any arm reaching) or far from the hand (i.e., requiring arm reaching). Graph (B) summarizes the key results for both reaching (bar graph, below) and grasping (line graph, above). The bar graph depicts the reaching error as the distance between the target and the landing position (left y axis, from 0 to 50 mm) for the left and the right arm in conditions of either central fixation or free-viewing, for both M.H. (in black) and age-matched controls (in white). It should be noted that only outward reaching toward far objects were used in the graph (for further details please see the original article). The line graph depicts the distance between the index finger and thumb (maximum grip aperture—MGA, right y axis, from 80 to 140 mm) for grasping actions extended toward big and small objects by the left or right arm in conditions of fixation for both M.H. (in black) and age-matched controls (in white). Asterisks highlight significance differences between M.H. and controls. Errors bars depict standard deviations.
Figure 4
Figure 4
Schematic representation of the set-up used for testing obstacle avoidance, and the results obtained. (A) is a schematic representation of the set-up used by Rice et al. (2008). The black cross depicts the fixation point and the white dot the starting position. M.H. and controls were asked to reach to the dark gray strip at the back of the platform, passing the hand between the obstacles (cylinders). Graph (B) summarizes the mean amount of change in trajectory resulting from changing the location of either obstacle: in striking contrast to controls, when M.H. reached using with his right arm his trajectories were completely unaffected by the location of the obstacle within the right half-field. Asterisks highlight significance differences between M.H. and controls.
Figure 5
Figure 5
Schematic representation of the set-up used for testing reaching with the lower limb, and a comparison between the results obtained with lower vs. upper limbs. (A) is a schematic representations of the set-up used Evans et al. (2013). The black cross depicts the fixation point, the white rectangles show the possible target locations (only one target at a time was presented), and the dark gray rectangle indicates the edge of the step from which participants stepped down to make a “leg-reach.” Graph (B) represents the reaching error (the distance between the target and the landing position of the foot) for the left and right leg in conditions of fixation and free viewing, for both M.H. (in white) and age-matched controls (in black). Data have been plotted by subtracting the error in left space from the error in right space. (C) depicts the error for the upper limbs (arm) showed in graph 3b, by subtracting reaching errors made in the left visual field from errors made in the right visual field [this allows a direct comparison between the errors made with the leg in (B) and the arm in (C)]. Reaching errors executed in free viewing using the left hand are not depicted as data were not collected for that condition. For both graphs, the higher the value on the y axis, the greater the reaching error in the right half-field. Asterisks highlight significance differences between M.H. and controls.

References

    1. Andersen R. A. (1987). Neurons of area 7 activated by both visual stimuli and oculomotor behavior, in The Handbook of Physiology. Section I: The Nervous System Volume V. Higher Functions of the Brain Part 2, eds Plum M. F., Mountcastle V. B., Geiger S. R. (Bethesda, MD: American Physiological Society; ), 483–518
    1. Andersen R. A. (1989). Visual and eye-movement functions of the posterior parietal cortex. Annu. Rev. Neurosci. 12, 377–403 10.1146/annurev.ne.12.030189.002113 - DOI - PubMed
    1. Andersen R. A., Cui H. (2009). Intention, action planning, and decision making in parietal-frontal circuits. Neuron 63, 568–583 10.1016/j.neuron.2009.08.028 - DOI - PubMed
    1. Astafiev S. V., Shulman G. L., Stanley C. M., Snyder A. Z., Van Essen D. C., Corbetta M. (2003). Functional organization of human intraparietal and frontal cortex for attending, looking, and pointing. J. Neurosci. 23, 4689–4699 - PMC - PubMed
    1. Azanon E., Longo M. R., Soto-Faraco S., Haggard P. (2010). The posterior parietal cortex remaps touch into external space. Curr. Biol. 20, 1304–1309 10.1016/j.cub.2010.05.063 - DOI - PubMed

LinkOut - more resources