. 2013 Jul 19:4:263.
doi: 10.3389/fpls.2013.00263. eCollection 2013.

Metabolic engineering of raffinose-family oligosaccharides in the phloem reveals alterations in carbon partitioning and enhances resistance to green peach aphid

Affiliations

Metabolic engineering of raffinose-family oligosaccharides in the phloem reveals alterations in carbon partitioning and enhances resistance to green peach aphid

Te Cao et al. Front Plant Sci. .

Abstract

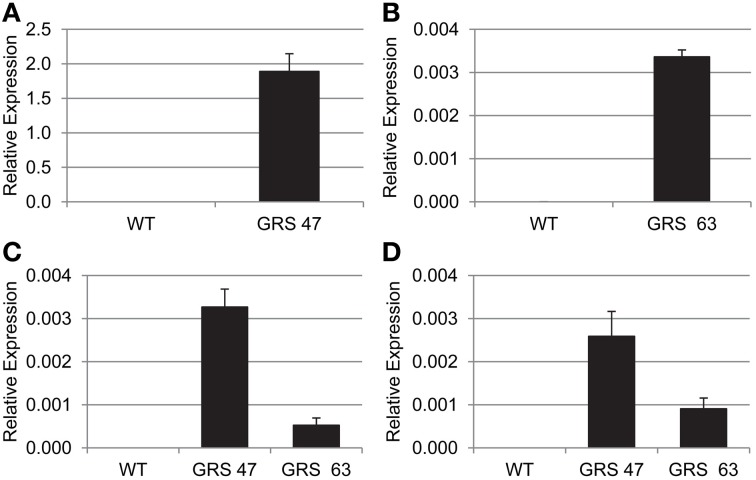
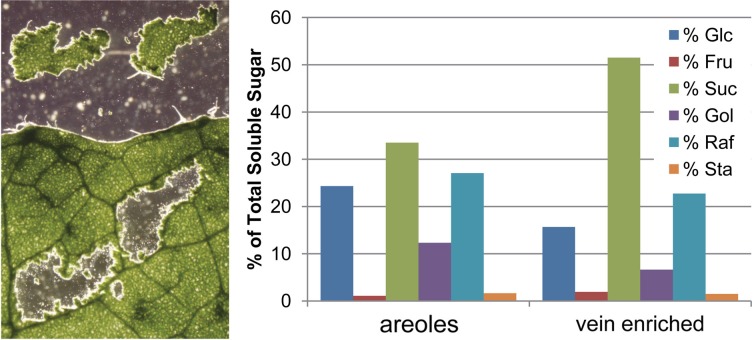
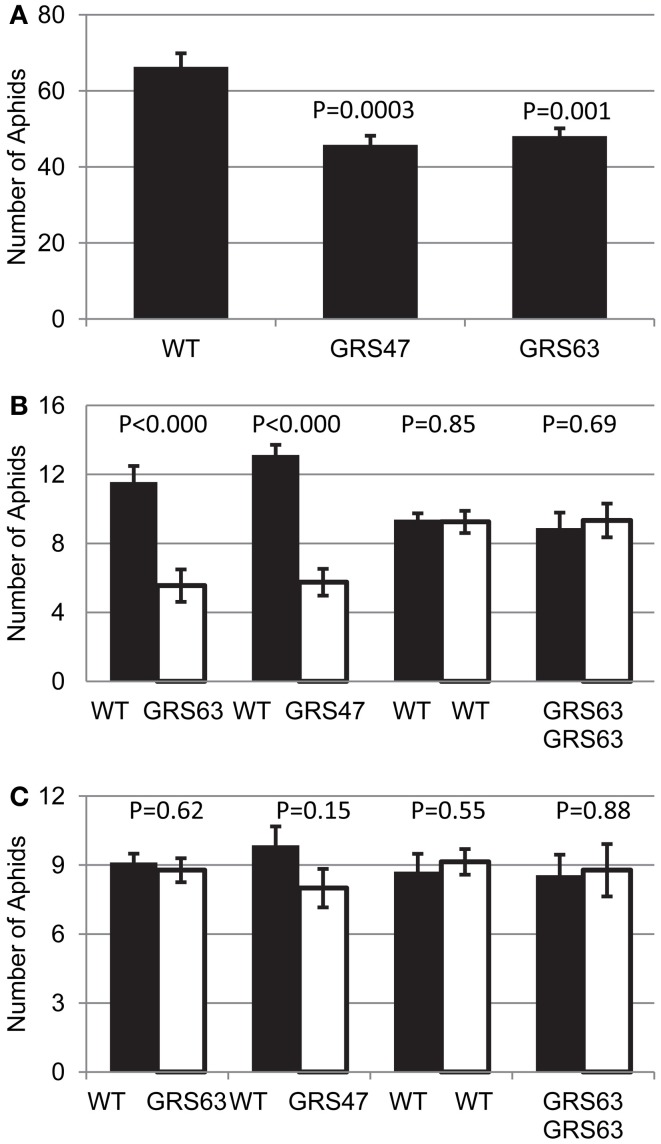
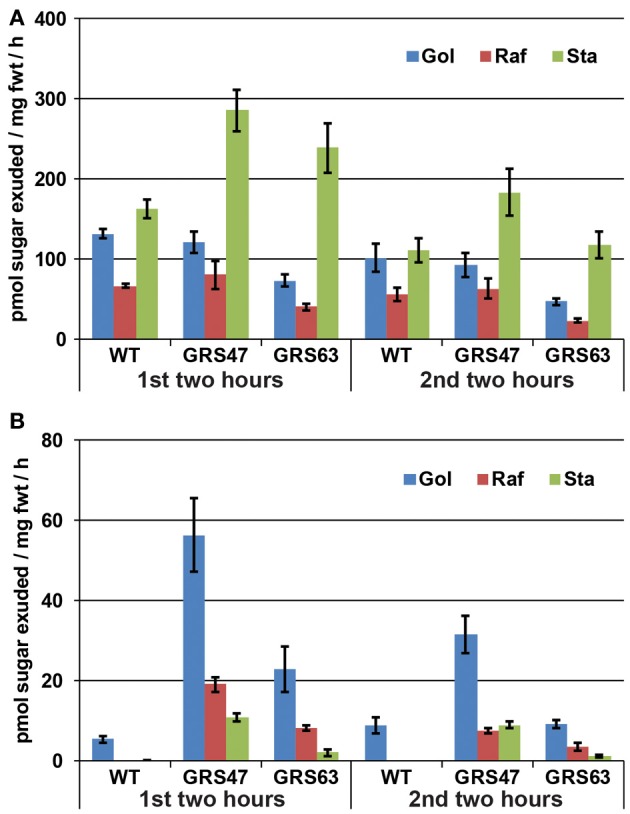
Many plants employ energized loading strategies to accumulate osmotically-active solutes into the phloem of source organs to accentuate the hydrostatic pressure gradients that drive the flow of water, nutrients and signals from source to sinks. Proton-coupled symport of sugars from the apoplasm into the phloem symplasm is the best studied phloem-loading mechanism. As an alternative, numerous species use a polymer trapping mechanism to load through symplasm: sucrose enters the phloem through specialized plasmodesmata and is converted to raffinose-family oligosaccharides (RFOs) which accumulate because of their larger size. In this study, metabolic engineering was used to generate RFOs at the inception of the translocation stream of Arabidopsis thaliana, which loads from the apoplasm and transports predominantly sucrose, and the fate of the sugars throughout the plant determined. Three genes, GALACTINOL SYNTHASE, RAFFINOSE SYNTHASE and STACHYOSE SYNTHASE, were expressed from promoters specific to the companion cells of minor veins. Two transgenic lines homozygous for all three genes (GRS63 and GRS47) were selected for further analysis. Three-week-old plants of both lines had RFO levels approaching 50% of total soluble sugar. RFOs were also identified in exudates from excised leaves of transgenic plants whereas levels were negligible in exudates from wild type (WT) leaves. Differences in starch accumulation between WT and GRS63 and GRS47 lines were not observed. Similarly, there were no differences in vegetative growth between WT and engineered plants, but the latter flowered slightly earlier. Finally, since the sugar composition of the translocation stream appeared altered, we tested for an impact on green peach aphid (Myzus persicae Sulzer) feeding. When given a choice between WT and transgenic plants, green peach aphids preferred settling on the WT plants. Furthermore, green peach aphid fecundity was lower on the transgenic plants compared to the WT plants. When added to an artificial diet, RFOs did not have a negative effect on aphid fecundity, suggesting that although aphid resistance in the transgenic plants is enhanced, it is not due to direct toxicity of RFO toward the insect.

Keywords: green peach aphid; metabolic engineering; phloem transport; raffinose family oligosaccharides; sugar transport.


Figures

Figure 1
Figure 1
Comparison of carbohydrate levels after 10 h of dark and 8 h into the 14 h illuminated period. (A) Soluble neutral sugars as indicated (pmol sugar/mg fresh weight) (note: separation conditions were optimized for Gol, Raf, and Sta, and Glc and Gal elute together. In elutions that do separate Glc and Gal, Gal levels were always negligible). (B) Starch levels from the same samples as (A), expressed as Glc equivalents. Variation is expressed as SE; n = 6 sibling plants. Student's t-Test analysis was also conducted to assess differences (p < 0.05) in the level of each sugar within each line between 10 h of dark and 8 h of illumination. Glc, Fru, and starch were significantly increased in all lines, Suc increased significantly only in WT, and none of the RFO sugars in any line showed a significant difference between 10 h of dark and 8 h or illumination.
Figure 2
Figure 2
Transgene transcript abundance as determined by RT-qPCR, relative to EF1a expression. (A) CmGAS1 expression in WT and GRS47 (note the Y-axis scale). (B) CmGAS1 expression in WT and GRS63. (C) CsRFS expression in WT, GRS47 and GRS63. (D) AmSTS expression in WT, GRS47 and GRS63. Variation is expressed as SD; n = 4 sibling plants.
Figure 3
Figure 3
Soluble sugars in areoles and vein-enriched sections. (Left) Representative leaf that was flash frozen on powdered dry ice, lyophilized, and micro-dissected for areoles (sections containing only mesophyll cells and associated epidermis surrounded by minor veins). Vein-enriched sections (not shown) contained the minor veins and closely associated mesophyll that bordered the areole sections. (Right) Distribution of soluble sugars in pooled areoles and pooled vein-enriched sections, expressed as percentage of total detected sugar.
Figure 4
Figure 4
Soluble carbohydrates in phloem exudates from wild type and transgenic plants. (A) Exudation rates for Glc, Fru, and Suc. (B) Exudation rates for Gol, Raf, and Sta. Note the difference scales of the Y axis between (A) and (B). Variation is expressed as SE; n = 12 sibling plants.
Figure 5
Figure 5
Soluble carbohydrates in rosettes and roots of WT and GRS47 and GRS63 grown for 16 and 21 d on sterile MS media in vertically oriented plants. (A) Glc, Fru, and Suc in the rosettes of each line at the indicated number of days, (B) Gol, Raf, and Sta in the same rosettes as indicated for (A); note the difference in Y-axis scale. (C) Glc, Fru, and Suc in the roots of the same plants indicated in (A), and (D) Gol, Raf, and Sta in the roots of the same plants indicated in (A). All sugar values are averages expressed as pmol/mg fresh weight, n = 4, and variation is expressed as SE.
Figure 6
Figure 6
Analysis of vegetative growth and the transition to reproductive growth in WT and transgenic lines. (A) Rosette area at 17 dag; average and SE values from 12 replicates. (B) Percentage of plants flowering relative to days post germination. (C) Number of rosette leaves at the time of flowering. Average and SE, n = 36.
Figure 7
Figure 7
Aphid behavior on WT and RFO-producing plants. (A) Aphid populations on each plant after 48 h in a “no-choice” experiment (starting population = 20 adults). Average and SE, n = 12. (B) Adult aphids settled on each plant after 24 h in a “choice” experiment (starting population = 20 adults, released equidistant between the indicated plants). (C) As in (B), but 8 h after aphid release. (B,C), average and SE, n = 9. t-test p-values are indicated on each graph.
Figure 8
Figure 8
The impact of the indicated sugar on aphid populations fed an artificial diet for 96 h. Three adult aphids were released into the feeding chamber and allowed to feed on the diet through the sachet. The total number of aphids (adults + nymphs) were determined 96 h later. Average and SE, n = 3 replicates; t-test p-values, relative to diet without supplemental sugar are indicated on the graph.
Figure A1
Figure A1
Soluble carbohydrates in phloem exudates from wild type and transgenic plants. This representative experiment is similar to that presented in Figure 4 except that they were conducted on 16 d-old whole rosettes with only the cut hypocotyl in EDTA to minimize exposure during exudations. In addition, EDTA was reduced to 5 mM. Similar to other exudation experiments, exudations were performed in dim conditions and 100% humidity to minimize EDFTA uptake through the xylem. (A) Exudation rates for Glc, Fru, and Suc. (B) Exudation rates for Gol, Raf, and Sta. Note the difference scales of the Y axis between (A) and (B). Variation is expressed as SE; n = 6 sibling plants.

References

    1. Ayre B. G. (2011). Membrane-transport systems for sucrose in relation to whole-plant carbon partitioning. Mol. Plant 4, 377–394 10.1093/mp/ssr014 - DOI - PubMed
    1. Ayre B. G., Blair J. E., Turgeon R. (2003a). Functional and phylogenetic analyses of a conserved regulatory program in the phloem of minor veins. Plant Physiol. 133, 1229–1239 10.1104/pp.103.027714 - DOI - PMC - PubMed
    1. Ayre B. G., Keller F., Turgeon R. (2003b). Symplastic continuity between companion cells and the translocation stream: long-distance transport is controlled by retention and retrieval mechanisms in the phloem. Plant Physiol. 131, 1518–1528 10.1104/pp.012054 - DOI - PMC - PubMed
    1. Ayre B. G., Turgeon R. (2004). Graft transmission of a floral stimulant derived from CONSTANS. Plant Physiol. 135, 2271–2278 10.1104/pp.104.040592 - DOI - PMC - PubMed
    1. Bailly C., Audigier C., Ladonne F., Wagner M. H., Coste F., Corbineau F., et al. (2001). Changes in oligosaccharide content and antioxidant enzyme activities in developing bean seeds as related to acquisition of drying tolerance and seed quality. J. Exp. Bot. 52, 701–708 - PubMed

LinkOut - more resources