

Clinical impact of sample interference on intensive insulin therapy in severely burned patients: a pilot study
- PMID: 23884048
- PMCID: PMC3815489
- DOI: 10.1097/BCR.0b013e31829b3700
Clinical impact of sample interference on intensive insulin therapy in severely burned patients: a pilot study
Erratum in
- J Burn Care Res. 2014 Nov-Dec;35(6):533
Abstract
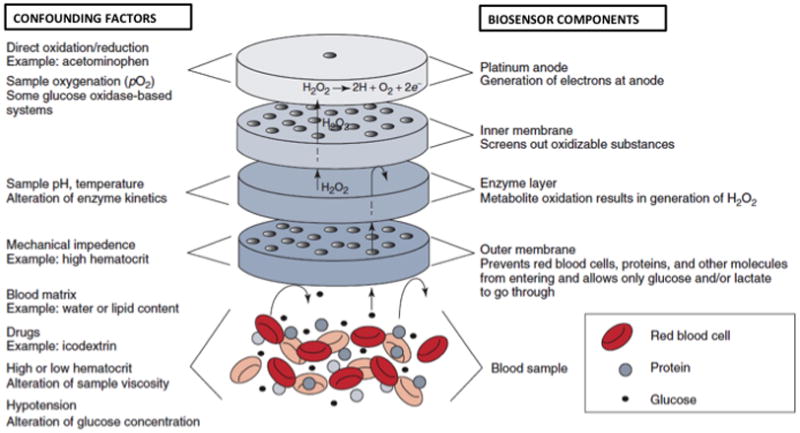
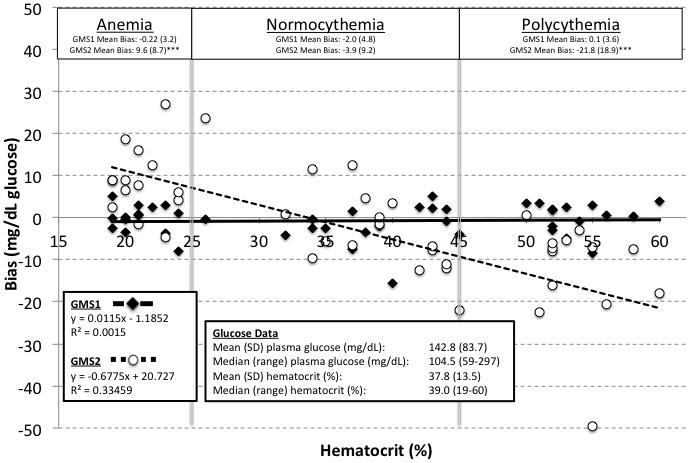
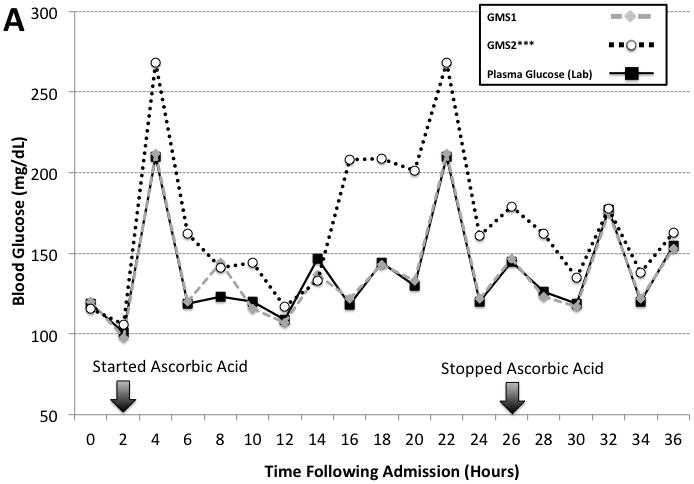
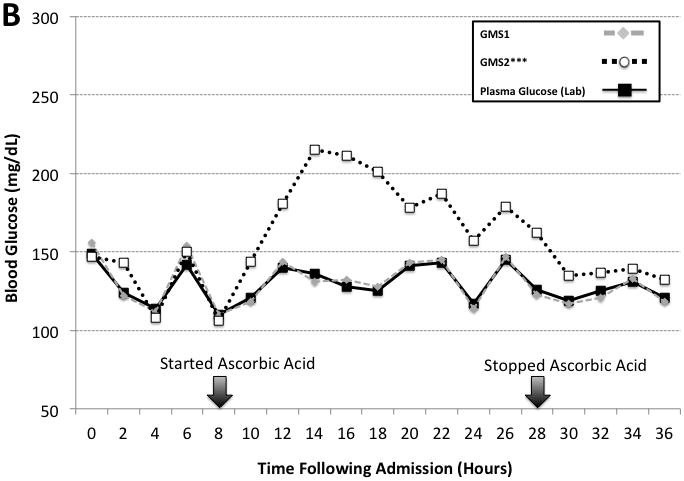
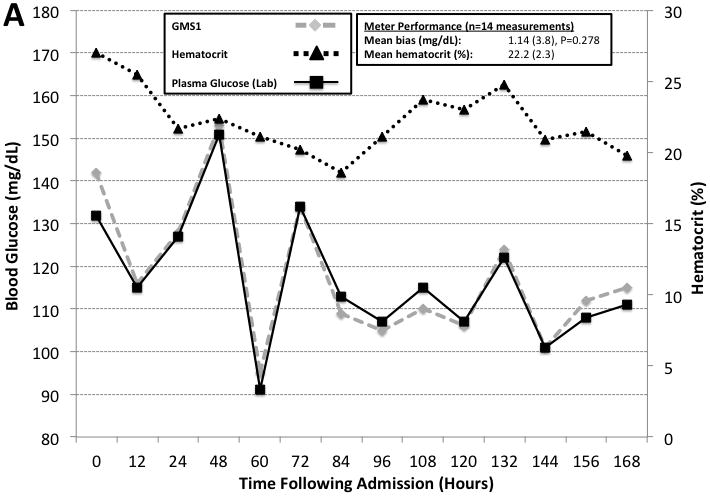
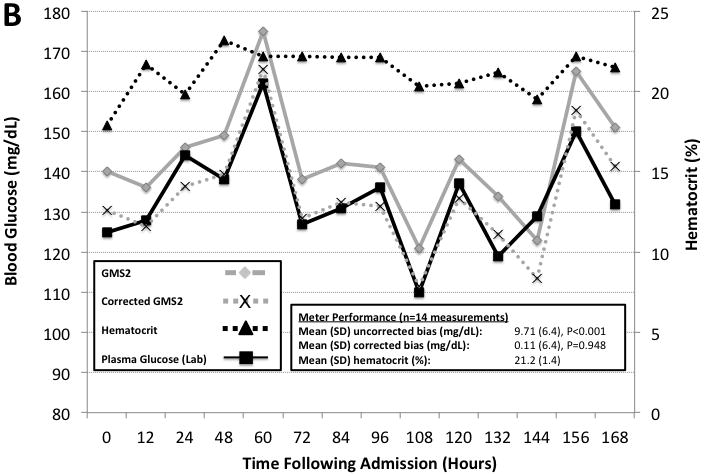
Severely burned patients benefit from intensive insulin therapy (IIT) for tight glycemic control (TGC). The authors evaluated the clinical impact of automatic correction of hematocrit and ascorbic acid interference for bedside glucose monitoring performance in critically ill burn patients. The performance of two point-of-care glucose monitoring systems (GMSs): 1) GMS1, an autocorrecting device, and 2) GMS2, a noncorrecting device were compared. Sixty remnant arterial blood samples were collected in a prospective observational study to evaluate hematocrit and ascorbic acid effects on GMS1 vs GMS2 accuracy paired against a plasma glucose reference. Next, we enrolled 12 patients in a pilot randomized controlled trial. Patients were randomized 1:1 to receive IIT targeting a TGC interval of 111 to 151 mg/dl and guided by either GMS1 or GMS2. GMS bias, mean insulin rate, and glycemic variability were calculated. In the prospective study, GMS1 results were similar to plasma glucose results (mean bias, -0.75 [4.0] mg/dl; n = 60; P = .214). GMS2 results significantly differed from paired plasma glucose results (mean bias, -5.66 [18.7] mg/dl; n = 60; P = .048). Ascorbic acid therapy elicited significant GMS2 performance bias (29.2 [27.2]; P < .001). Randomized controlled trial results reported lower mean bias (P < .001), glycemic variability (P < .05), mean insulin rate (P < .001), and frequency of hypoglycemia (P < .001) in the GMS1 group than in the GMS2 group. Anemia and high-dose ascorbic acid therapy negatively impact GMS accuracy and TGC in burn patients. Automatic correction of confounding factors improves glycemic control. Further studies are warranted to determine outcomes associated with accurate glucose monitoring during IIT.
Conflict of interest statement
Figures
Similar articles
-
Clinical Impact of Accurate Point-of-Care Glucose Monitoring for Tight Glycemic Control in Severely Burned Children.Pediatr Crit Care Med. 2016 Sep;17(9):e406-12. doi: 10.1097/PCC.0000000000000877. Pediatr Crit Care Med. 2016. PMID: 27472251 Free PMC article.
-
Intensive insulin therapy in critically ill hospitalized patients: making it safe and effective.J Diabetes Sci Technol. 2011 May 1;5(3):755-67. doi: 10.1177/193229681100500330. J Diabetes Sci Technol. 2011. PMID: 21722591 Free PMC article. Review.
-
The use of exenatide in severely burned pediatric patients.Crit Care. 2010;14(4):R153. doi: 10.1186/cc9222. Epub 2010 Aug 11. Crit Care. 2010. PMID: 20701787 Free PMC article. Clinical Trial.
-
Effects of dynamic temperature and humidity stresses on point-of-care glucose testing for disaster care.Disaster Med Public Health Prep. 2012 Oct;6(3):232-40. doi: 10.1001/dmp.2012.42. Disaster Med Public Health Prep. 2012. PMID: 23077265
-
Are closed-loop systems for intensive insulin therapy ready for prime time in the ICU?Curr Opin Clin Nutr Metab Care. 2014 Mar;17(2):190-9. doi: 10.1097/MCO.0000000000000026. Curr Opin Clin Nutr Metab Care. 2014. PMID: 24378668 Review.
Cited by
-
Impact of Glucose Meter Error on Glycemic Variability and Time in Target Range During Glycemic Control After Cardiovascular Surgery.J Diabetes Sci Technol. 2015 Aug 25;10(2):336-42. doi: 10.1177/1932296815602099. J Diabetes Sci Technol. 2015. PMID: 26311721 Free PMC article.
-
A Retrospective Analysis of Clinical Laboratory Interferences Caused by Frequently Administered Medications in Burn Patients.J Burn Care Res. 2016 Jan-Feb;37(1):e10-7. doi: 10.1097/BCR.0000000000000298. J Burn Care Res. 2016. PMID: 26536541 Free PMC article.
-
Unintended Consequence of High-Dose Vitamin C Therapy for an Oncology Patient: Evaluation of Ascorbic Acid Interference With Three Hospital-Use Glucose Meters.J Diabetes Sci Technol. 2021 Jul;15(4):897-900. doi: 10.1177/1932296820932186. Epub 2020 Jun 7. J Diabetes Sci Technol. 2021. PMID: 32506941 Free PMC article.
-
Hypoglycemic episodes predict length of stay in patients with acute burns.J Crit Care. 2021 Aug;64:68-73. doi: 10.1016/j.jcrc.2021.03.005. Epub 2021 Mar 24. J Crit Care. 2021. PMID: 33794469 Free PMC article.
-
35ème congrès SFB, table ronde «nutrition»: transcription des communications.Ann Burns Fire Disasters. 2015 Dec 31;28(4):296-309. Ann Burns Fire Disasters. 2015. PMID: 27777551 Free PMC article. French.
References
-
- Van den Berghe G, Wouters P, Weekers F, et al. Intensive insulin therapy in critically ill patients. N Engl J Med. 2001;345:1359–1367. - PubMed
-
- Gibson BR, Galiatsatos P, Rabiee A, et al. Intensive insulin therapy confers a similar survival benefit in the burn intensive care unit to the surgical intensive care unit. Surgery. 2009;146:922–930. - PubMed
-
- Meyfroidt G, Keenan DM, Wang X, et al. Dynamic characteristics of blood glucose time series course during the course of critical illness: effects of intensive insulin therapy and relative association with mortality. Crit Care Med. 2010;38:1021–1029. - PubMed
-
- Krinsley JS. Glycemic variability: a strong independent predictor of mortality in critically ill patients. Crit Care Med. 2008;36:3008–3013. - PubMed
-
- Ballian N, Rabiee A, Anderson DK, et al. Glucose metabolism in burn patients: the role of insulin and other endocrine hormones. Burns. 2010;36:599–605. - PubMed
Publication types
MeSH terms
Substances
Grants and funding
LinkOut - more resources
Full Text Sources
Other Literature Sources
Medical
