

Transcriptional suppression of CYP2A13 expression by lipopolysaccharide in cultured human lung cells and the lungs of a CYP2A13-humanized mouse model
- PMID: 23884085
- PMCID: PMC3807623
- DOI: 10.1093/toxsci/kft165
Transcriptional suppression of CYP2A13 expression by lipopolysaccharide in cultured human lung cells and the lungs of a CYP2A13-humanized mouse model
Abstract
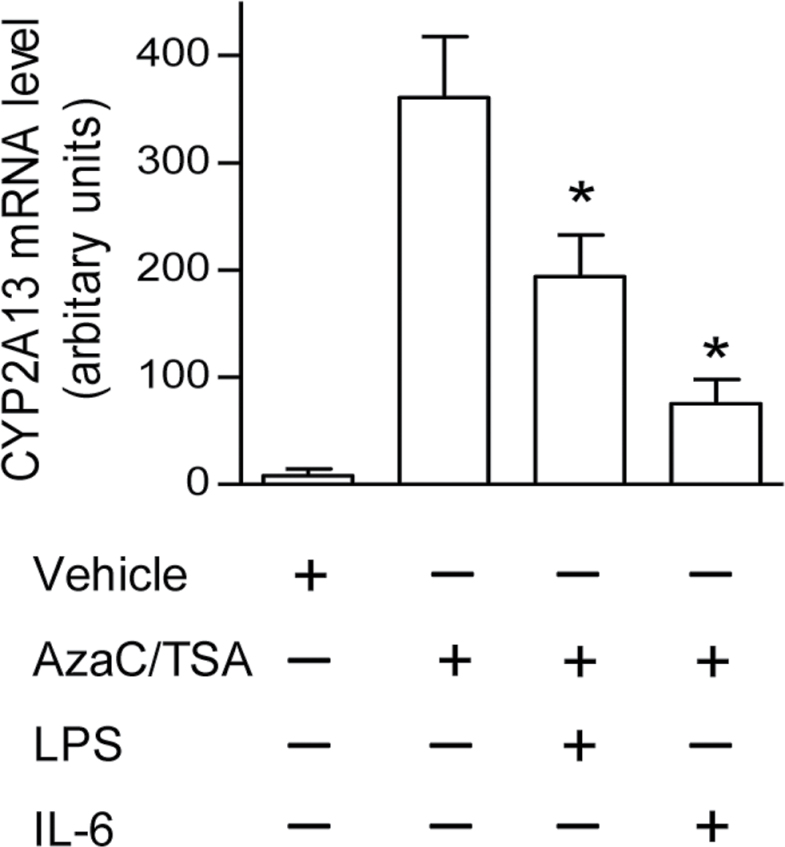
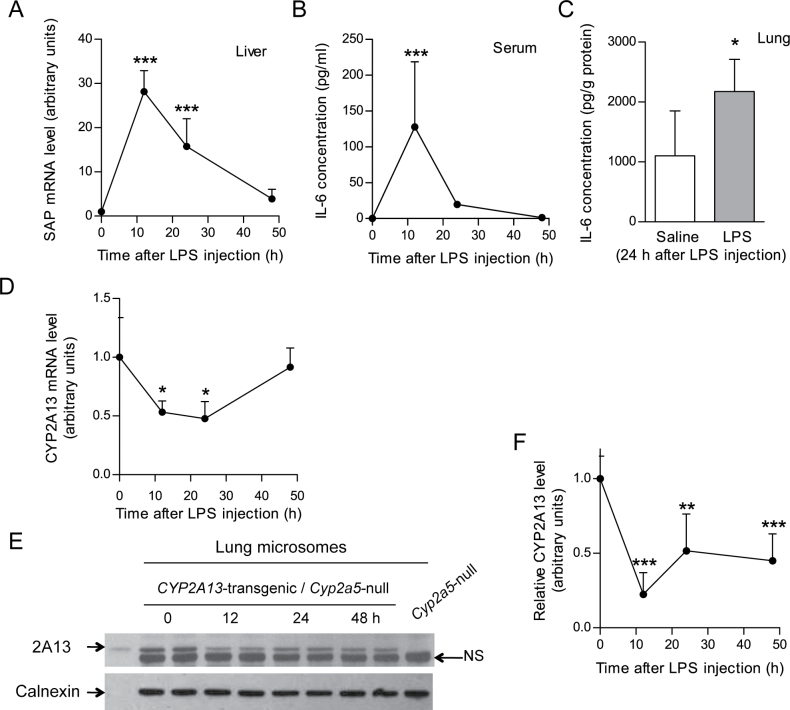
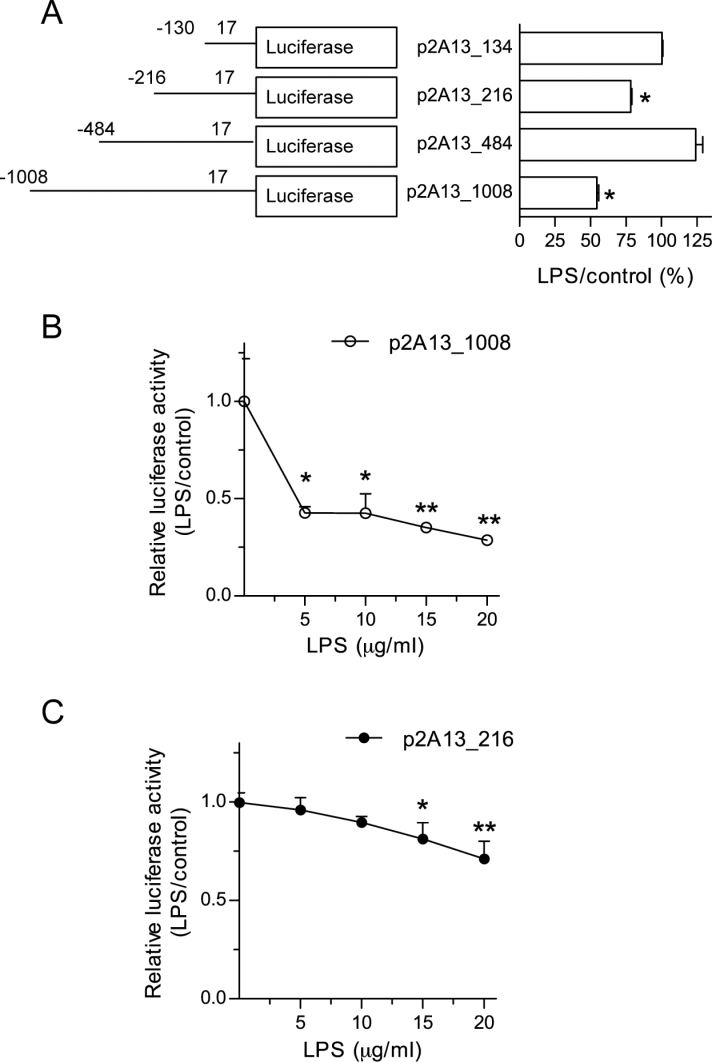
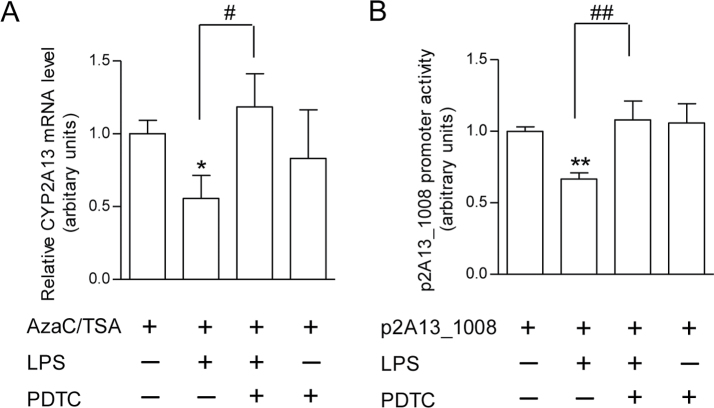
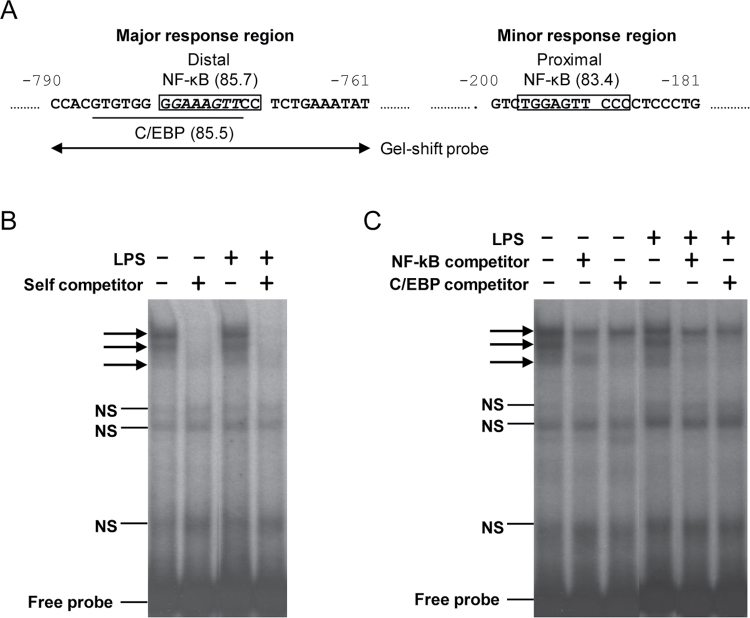
CYP2A13, a human P450 enzyme preferentially expressed in the respiratory tract, is highly efficient in the metabolic activation of tobacco-specific nitrosamines. The aim of this study was to test the hypothesis that inflammation suppresses CYP2A13 expression in the lung, thus explaining the large interindividual differences in CYP2A13 levels previously found in human lung biopsy samples. We first demonstrated that the bacterial endotoxin lipopolysaccharide (LPS) and the proinflammatory cytokine IL-6 can suppress CYP2A13 messenger RNA (mRNA) expression in the NCI-H441 human lung cell line. We then report that an ip injection of LPS (1mg/kg), which induces systemic and lung inflammation, caused substantial reductions in CYP2A13 mRNA (~50%) and protein levels (~80%) in the lungs of a newly generated CYP2A13-humanized mouse model. We further identified two critical CYP2A13 promoter regions, one (major) between -484 and -1008bp and the other (minor) between -134 and -216bp, for the response to LPS, through reporter gene assays in H441 cells. The potential involvement of the nuclear factor NF-κB in LPS-induced CYP2A13 downregulation was suggested by identification of putative NF-κB binding sites within the LPS response regions and effects of an NF-κB inhibitor (pyrrolidine dithiocarbamate) on CYP2A13 expression in H441 cells. Results from gel shift assays further confirmed binding of NF-κB-like nuclear proteins of H441 cells to the major LPS response region of the CYP2A13 promoter. Thus, our findings strongly support the hypothesis that CYP2A13 levels in human lung can be suppressed by inflammation associated with disease status in tissue donors, causing underestimation of CYP2A13 levels in healthy lung.
Keywords: CYP2A; LPS; chemical carcinogenesis.; inflammation; lung.
Figures
Similar articles
-
Suppression of pulmonary CYP2A13 expression by carcinogen-induced lung tumorigenesis in a CYP2A13-humanized mouse model.Drug Metab Dispos. 2015 May;43(5):698-702. doi: 10.1124/dmd.115.063305. Epub 2015 Feb 20. Drug Metab Dispos. 2015. PMID: 25710941 Free PMC article.
-
Transcriptional regulation of human CYP2A13 expression in the respiratory tract by CCAAT/enhancer binding protein and epigenetic modulation.Mol Pharmacol. 2007 Mar;71(3):807-16. doi: 10.1124/mol.106.031104. Epub 2006 Dec 5. Mol Pharmacol. 2007. PMID: 17148654
-
Mechanisms of differential expression of the CYP2A13 7520C and 7520G alleles in human lung: allelic expression analysis for CYP2A13 heterogeneous nuclear RNA, and evidence for the involvement of multiple cis-regulatory single nucleotide polymorphisms.Pharmacogenet Genomics. 2009 Nov;19(11):852-63. doi: 10.1097/FPC.0b013e3283313aa5. Pharmacogenet Genomics. 2009. PMID: 20431511 Free PMC article.
-
Pulmonary expression of CYP2A13 and ABCB1 is regulated by FOXA2, and their genetic interaction is associated with lung cancer.FASEB J. 2015 May;29(5):1986-98. doi: 10.1096/fj.14-264580. Epub 2015 Feb 9. FASEB J. 2015. PMID: 25667220
-
Human cytochrome P450 CYP2A13: predominant expression in the respiratory tract and its high efficiency metabolic activation of a tobacco-specific carcinogen, 4-(methylnitrosamino)-1-(3-pyridyl)-1-butanone.Cancer Res. 2000 Sep 15;60(18):5074-9. Cancer Res. 2000. PMID: 11016631
Cited by
-
Detection of Transgene Location in the CYP2A13/2B6/2F1-transgenic Mouse Model using Optical Genome Mapping Technology.Drug Metab Dispos. 2023 Jan;51(1):46-53. doi: 10.1124/dmd.122.001090. Epub 2022 Oct 23. Drug Metab Dispos. 2023. PMID: 36273825 Free PMC article.
-
Role of CYP2A13 in the bioactivation and lung tumorigenicity of the tobacco-specific lung procarcinogen 4-(methylnitrosamino)-1-(3-pyridyl)-1-butanone: in vivo studies using a CYP2A13-humanized mouse model.Carcinogenesis. 2014 Jan;35(1):131-7. doi: 10.1093/carcin/bgt269. Epub 2013 Aug 5. Carcinogenesis. 2014. PMID: 23917075 Free PMC article.
-
Genetic and Enzymatic Characteristics of CYP2A13 in Relation to Lung Damage.Int J Mol Sci. 2021 Nov 14;22(22):12306. doi: 10.3390/ijms222212306. Int J Mol Sci. 2021. PMID: 34830188 Free PMC article. Review.
-
Expression of xenobiotic metabolising enzymes in lungs of horses with or without histological evidence of lower airway inflammation.Vet Med Sci. 2021 Jan;7(1):16-24. doi: 10.1002/vms3.331. Epub 2020 Aug 13. Vet Med Sci. 2021. PMID: 32791560 Free PMC article.
-
Suppression of pulmonary CYP2A13 expression by carcinogen-induced lung tumorigenesis in a CYP2A13-humanized mouse model.Drug Metab Dispos. 2015 May;43(5):698-702. doi: 10.1124/dmd.115.063305. Epub 2015 Feb 20. Drug Metab Dispos. 2015. PMID: 25710941 Free PMC article.
References
-
- Abdulla D., Goralski K. B., Del Busto Cano E. G., Renton K. W. (2005). The signal transduction pathways involved in hepatic cytochrome P450 regulation in the rat during a lipopolysaccharide-induced model of central nervous system inflammation. Drug Metab. Dispos. 33, 1521–1531 - PubMed
-
- Aitken A. E., Richardson T. A., Morgan E. T. (2006). Regulation of drug-metabolizing enzymes and transporters in inflammation. Annu. Rev. Pharmacol. Toxicol. 46, 123–149 - PubMed
-
- Akira S., Taga T., Kishimoto T. (1993). Interleukin-6 in biology and medicine. Adv. Immunol. 54, 1–78 - PubMed
-
- Akiyama T. E., Gonzalez F. J. (2003). Regulation of P450 genes by liver-enriched transcription factors and nuclear receptors. Biochim. Biophys. Acta. 1619, 223–234 - PubMed
-
- Charles K. A., Rivory L. P., Brown S. L., Liddle C., Clarke S. J., Robertson G. R. (2006). Transcriptional repression of hepatic cytochrome P450 3A4 gene in the presence of cancer. Clin. Cancer Res. 12, 7492–7497 - PubMed
Publication types
MeSH terms
Substances
Grants and funding
LinkOut - more resources
Full Text Sources
Other Literature Sources
