. 2013 Jul 24;5(195):195ra97.
doi: 10.1126/scitranslmed.3006135.

CaMKII is essential for the proasthmatic effects of oxidation

Affiliations

CaMKII is essential for the proasthmatic effects of oxidation

Philip N Sanders et al. Sci Transl Med. .

Abstract

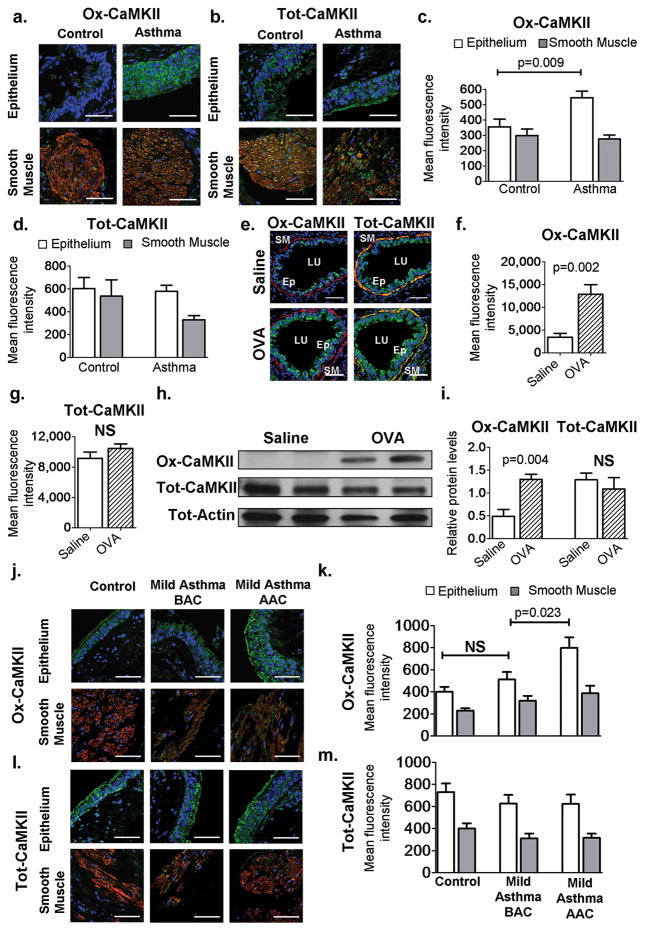
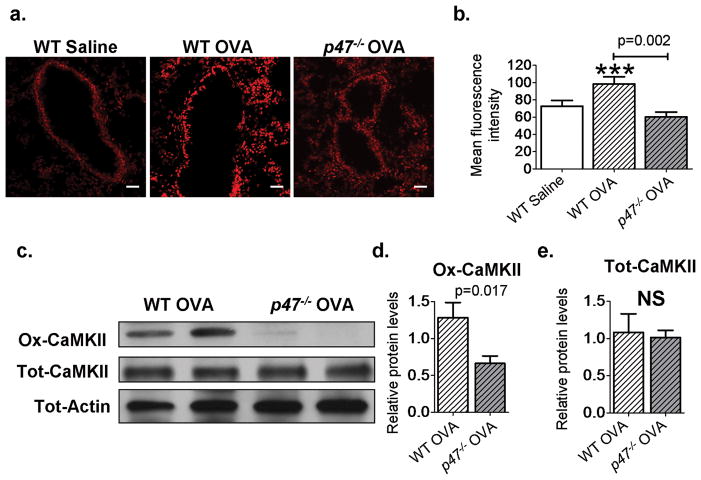
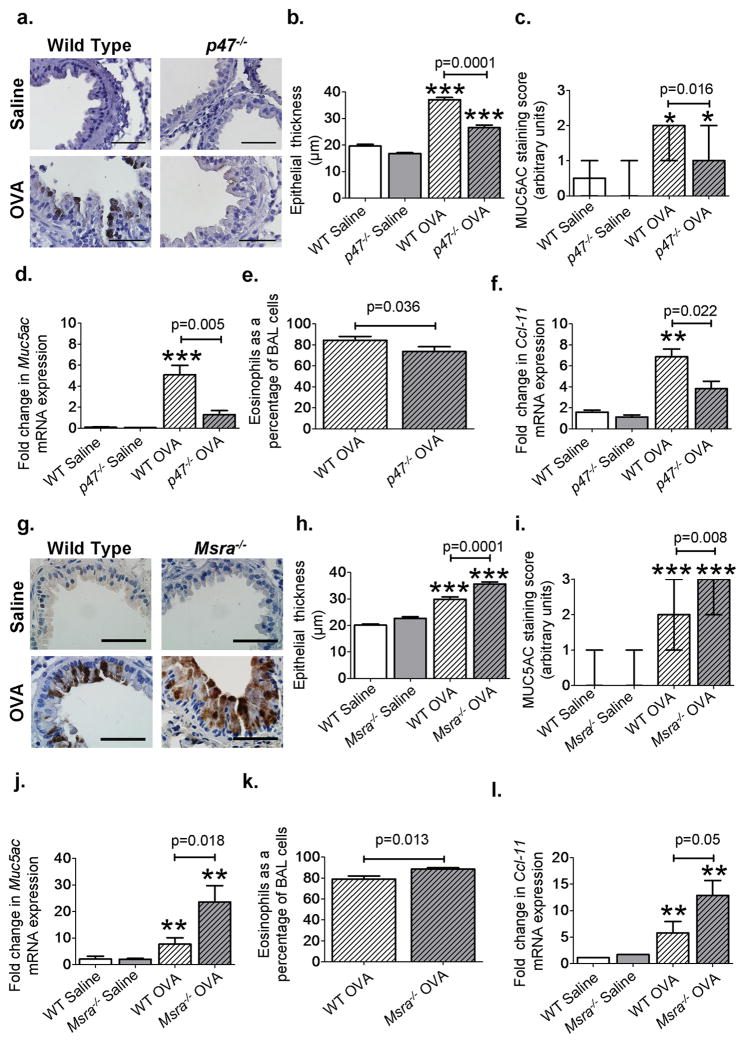
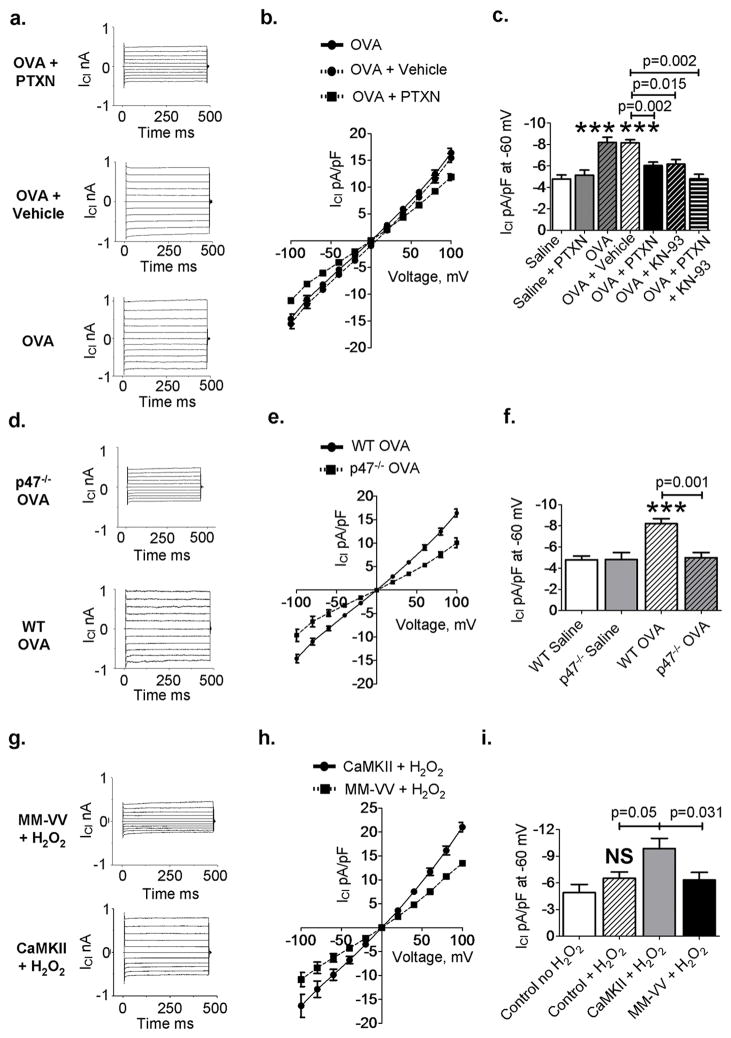
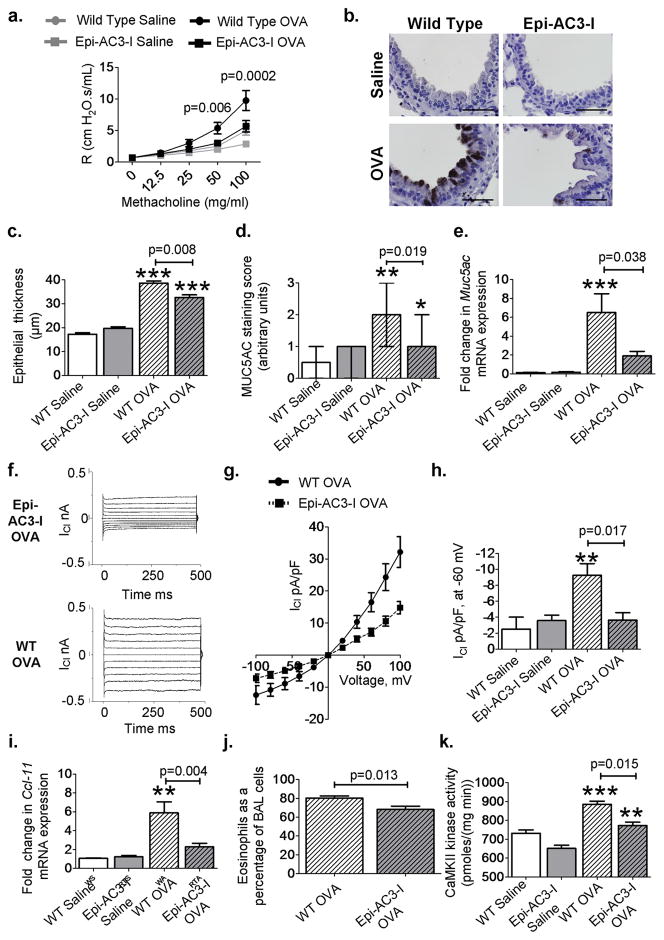
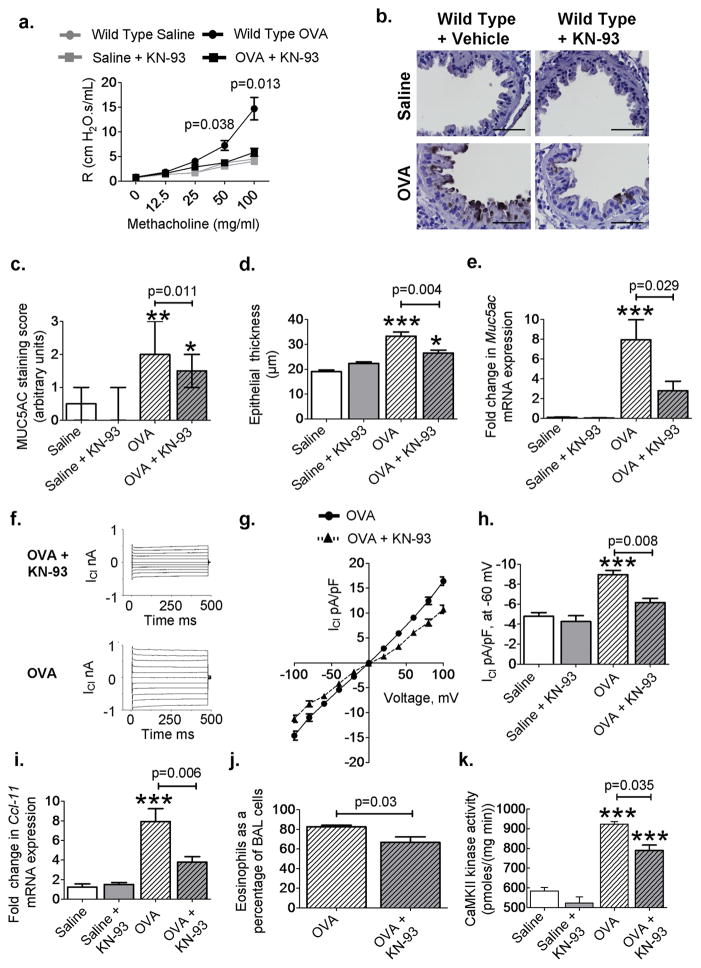
Increased reactive oxygen species (ROS) contribute to asthma, but little is known about the molecular mechanisms connecting increased ROS with characteristic features of asthma. We show that enhanced oxidative activation of the Ca(2+)/calmodulin-dependent protein kinase (ox-CaMKII) in bronchial epithelium positively correlates with asthma severity and that epithelial ox-CaMKII increases in response to inhaled allergens in patients. We used mouse models of allergic airway disease induced by ovalbumin (OVA) or Aspergillus fumigatus (Asp) and found that bronchial epithelial ox-CaMKII was required to increase a ROS- and picrotoxin-sensitive Cl(-) current (ICl) and MUC5AC expression, upstream events in asthma progression. Allergen challenge increased epithelial ROS by activating NADPH oxidases. Mice lacking functional NADPH oxidases due to knockout of p47 and mice with epithelial-targeted transgenic expression of a CaMKII inhibitory peptide or wild-type mice treated with inhaled KN-93, an experimental small-molecule CaMKII antagonist, were protected against increases in ICl, MUC5AC expression, and airway hyperreactivity to inhaled methacholine. Our findings support the view that CaMKII is a ROS-responsive, pluripotent proasthmatic signal and provide proof-of-concept evidence that CaMKII is a therapeutic target in asthma.


Conflict of interest statement

Competing interests

M.E.A., I.M.G., and J.N.K. are named inventors on a patent application from The University of Iowa claiming to treat asthma by CaMKII inhibition. Methods of Treating Pulmonary Diseases and Disorders by Modulating Calcium/Calmodulin Dependent Protein Kinase II Activity, Patent Number US 20110152172 A1. M.E.A. is a cofounder of Allosteros Therapeutics, a biotech aiming to develop enzyme inhibitor therapies. The remaining authors declare no competing interests.

Figures

Fig. 1
Fig. 1. Increased ox-CaMKII in asthmatic airway epithelium
(A and B) Localization of total and oxidized CaMKII in human airways (×400). Blue represents stained nuclei, green represents total (Tot) or ox-CaMKII, red represents α –smooth muscle actin (α-SMA), and yellow shows colocalization of CaMKII and α-SMA staining. (C and D) Mean fluorescence intensity of ox-CaMKII or tot-CaMKII staining in sections of human tissue per square micrometer (n = 14 asthma, n = 11 healthy), (E) Localization of ox-CaMKII or tot-CaMKII in murine airways (×400). In the panels, smooth muscle (SM), airway lumen (LU), and bronchial epithelium (Ep) are identified. (F and G) Mean fluorescence intensity per square micrometer of ox-CaMKII or tot-CaMKII staining in sequential sections of murine tissue (n = 6). (H) Representative ox-CaMKII and tot-CaMKII immunoblot images from murine whole-lung homogenates. (I). Quantification of immunoblots (n = 8 per group). Blots were stripped and re-probed for tot- CaMKII and tot-actin. (J and K) Ox-CaMKII staining and quantification in the epithelium and smooth muscle of control patients (n = 9) and patients with mild asthma before allergen challenge (BAC; n = 15) and after allergen challenge (AAC; n = 15). (L and M) Staining and quantification of tot- CaMKII in the epithelium and smooth muscle of control patients (n = 9) and patients with mild asthma before allergen challenge (n = 15) and after allergen challenge (n = 15). NS, not significant. Scale bars, 50 μm. Mann- Whitney was used for comparisons between control and asthmatic patients, and saline and OVA mice. Wilcoxon signed rank was used for comparison of mild asthmatics before and after allergen challenge.
Fig. 2
Fig. 2. Increased ROS in OVA mice leads to an up-regulation of ox-CaMKII
(A) DHE staining showing levels of ROS (×200). (B) Quantification of DHE staining in mouse lung sections; data show mean fluorescence intensity per square micrometer in the epithelium. Saline, n = 8; wild-type (WT) OVA, n = 9; p47−/− OVA, n = 9. (C) Immunoblot analysis of ox-CaMKII and tot-CaMKII in whole-lung homogenates from OVA WT and p47−/− mice. Immunoblots for WT saline, WT OVA, and p47−/− OVA are from the same gel as in Fig. 1H. (D and E) Quantification of immunoblot density of OVA WT (n = 8) and OVA p47−/− (n = 8). ***P < 0.001, versus saline control. Blots were stripped and re-probed for tot-CaMKII and tot-actin. Scale bars, 50 μm. ANOVA with Bonferroni’s correction was used to compare saline to OVA; Mann-Whitney was used for OVA-to-OVA comparison.
Fig. 3
Fig. 3. ROS pathways determine disease severity
(A) Representative images of MUC5AC-stained (brown) sections highlighting goblet cell hyperplasia in saline and OVA WT and p47−/− airways (×1000). (B) Epithelial thickness in saline (n = 4 per group), OVAp47−/−, and OVA WT airways (n = 7 per group). (C and D) Scoring of MUC5AC-positive cells in the airways and Muc5ac mRNA expression in whole-lung homogenates, saline controls (n = 4), p47−/− OVA mice (n = 10), and OVA WT mice (n = 10). (E and F) Eosinophil chemo-attractant Ccl-11 mRNA levels (saline groups n > 4, OVA groups n = 6) and bronchoalveolar lavage (BAL) eosinophils (n = 12) as a percentage of total cells in OVA p47−/− mice compared to OVA WT mice. (G) Representative images of MUC5AC staining in saline and OVAWT and MsrA−/− airways (×1000). (H) Epithelial thickness in murine airways (saline n > 4, OVA n = 7 per group). (I and J) MUC5AC-positive cells (saline n > 4, OVA n=9 per group) in the airways and Muc5ac mRNA expression (saline n=4, OVA n = 8 per group) in whole-lung homogenates. (K and L) BAL eosinophils (n = 13 per group) and Ccl-11 mRNA levels in whole-lung homogenates (saline n=4, OVA n=6 per group). *P < 0.05, **P < 0.01, ***P < 0.001, versus saline control. Scale bars, 50 μm. ANOVA with Bonferroni’s correction was used to compare saline to OVA; Mann-Whitney was used for OVA-to-OVA comparison.
Fig. 4
Fig. 4. Ox-CaMKII increases ICl in the airway epithelium
(A) Representative current traces and (B) summary current-voltage relationships from OVA WT tracheal epithelial cells untreated and treated with vehicle and PTXN. (C) Summary data for peak ICl recorded at −60 mV, a command voltage representative of respiratory epithelial cells’ resting membrane potential, from tracheal epithelial cells isolated from WT OVA or vehicle-treated mice ex vivo with PTXN or PTXN and KN-93 (n > 4). (D to F) ICl in tracheal epithelial cells isolated from OVA p47−/− mice compared to OVA WT mice (n > 6). (G and H) ICl was measured after challenge with H2O2 (200 μM) in murine primary tracheal epithelial cells infected with control lentivirus or lentivirus encoding WT CaMKII or oxidant-resistant CaMKII (MM-VV). (I) Summary data for peak ICl (n > 5). ***P < 0.001, versus controls. ANOVA with Bonferroni’s correction was used to compare saline to OVA; Mann-Whitney was used for OVA-to-OVA comparison.
Fig. 5
Fig. 5. Epithelial-targeted CaMKII inhibition reduces disease severity
(A) Airway resistance (R) in saline (n = 4) OVA Epi-AC3-I mice and OVA WT mice after methacholine inhalation (n > 8 per OVA group). (B) Representative images of MUC5AC-stained (brown) sections show goblet cell hyperplasia in saline and OVA WT and Epi-AC3-I lungs (×1000). (C and D) Epithelial thickness and goblet cell hyperplasia as assessed by MUC5AC staining score in saline (n = 5 per group) and OVA (n = 7 per group) airways. (E) Muc5ac mRNA expression in whole-lung homogenates from saline (n = 6), OVA (n = 10), and Epi-AC3-I OVA (n = 10). (F) Representative ICl current traces and (G) current-voltage relationship recorded from WT OVA and epi-AC3-I OVA respiratory epithelial cells. (H) Summary data for peak ICl recorded from tracheal epithelial cells freshly isolated from challenged mice, saline (n = 7 per group), OVA epi-AC3-I, and OVA WT mice (n = 7 per group). (I and J) Ccl-11 mRNA (saline n = 4, OVA n = 7 per group) and BAL eosinophils (n > 11 per group) as a percentage of total cells. (K) CaMKII activity in saline controls (n = 6), WT OVA (n = 5), and Epi-AC3-I (n = 4) mice. *P < 0.05, **P < 0.01, ***P < 0.001, versus saline control. Scale bars, 50 μm. ANOVA with Bonferroni’s correction was used to compare saline to OVA; Mann-Whitney was used for OVA-to-OVA comparison.
Fig. 6
Fig. 6. Inhalation of KN-93 reduces disease severity
(A) Airway resistance (R) in mice after methacholine challenge (saline n = 5, OVA n > 7 per group). (B) Representative images of MUC5AC-stained (brown) sections showing mucin-positive cells from saline and OVA mice with or without inhaled KN-93 (×1000). (C and D) Quantification of MUC5AC staining and measurement of bronchial epithelial thickness in saline (n = 4 per group), OVA (n = 7), and OVA + KN-93 (n = 6) airways. (E) Muc5ac mRNA expression in saline (n = 4), OVA (n = 7), and OVA + KN-93 (n = 10). (F) Representative current traces and (G) current-voltage relationship recorded from tracheal epithelial cells isolated from WT OVA mice treated with or without KN-93. (H) Summary data for peak ICl recorded from tracheal epithelial cells freshly isolated from saline (n = 7), OVA WT (n = 10), and OVA + KN-93 (n = 4). (I and J) Ccl-11 mRNA (saline n > 5, WT OVAn = 8, OVA + KN-93 n = 10) and BAL eosinophils as a percentage of total cells in OVA WT mice treated with KN-93 (n = 10) compared to OVA WT mice (n = 8). (K) CaMKII activity in KN-93–treated mice (saline n > 5, WT OVA n = 3, KN-93 OVA n = 5). *P < 0.05, **P < 0.01, ***P < 0.001, versus saline control. Scale bars, 50 μm. ANOVA with Bonferroni’s correction was used to compare saline to OVA; Mann-Whitney was used for OVA-to-OVA comparison.

References

    1. Barnett SB, Nurmagambetov TA. Costs of asthma in the United States: 2002–2007. J Allergy Clin Immunol. 2011;127:145–152. - PubMed
    1. Kerstjens HA, Engel M, Dahl R, Paggiaro P, Beck E, Vandewalker M, Sigmund R, Seibold W, Moroni-Zentgraf P, Bateman ED. Tiotropium in asthma poorly controlled with standard combination therapy. N Engl J Med. 2012;367:1198–1207. - PubMed
    1. Jarjour NN, Calhoun WJ. Enhanced production of oxygen radicals in asthma. J Lab Clin Med. 1994;123:131–136. - PubMed
    1. Casalino-Matsuda SM, Monzón ME, Forteza RM. Epidermal growth factor receptor activation by epidermal growth factor mediates oxidant-induced goblet cell metaplasia in human airway epithelium. Am J Respir Cell Mol Biol. 2006;34:581–591. - PMC - PubMed
    1. Abdala-Valencia H, Earwood J, Bansal S, Jansen M, Babcock G, Garvy B, Wills-Karp M, Cook-Mills JM. Nonhematopoietic NADPH oxidase regulation of lung eosinophilia and airway hyperresponsiveness in experimentally induced asthma. Am J Physiol Lung Cell Mol Physiol. 2007;292:L1111–L1125. - PMC - PubMed

Publication types

MeSH terms