

Human insulin resistance is associated with increased plasma levels of 12α-hydroxylated bile acids
- PMID: 23884887
- PMCID: PMC3837033
- DOI: 10.2337/db13-0639
Human insulin resistance is associated with increased plasma levels of 12α-hydroxylated bile acids
Abstract
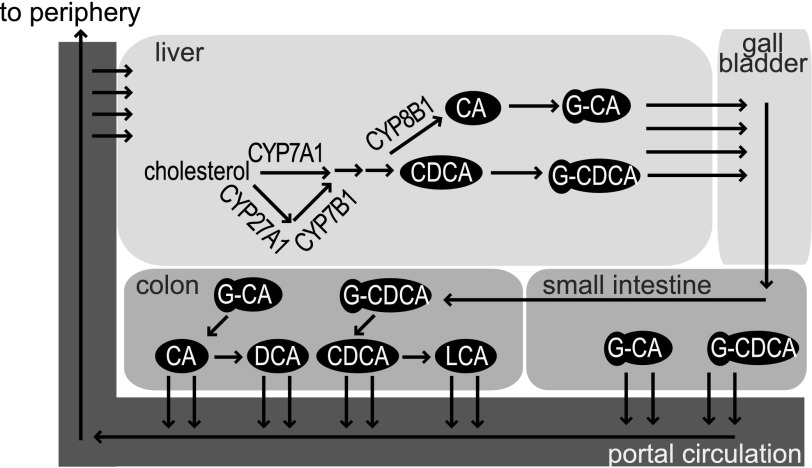
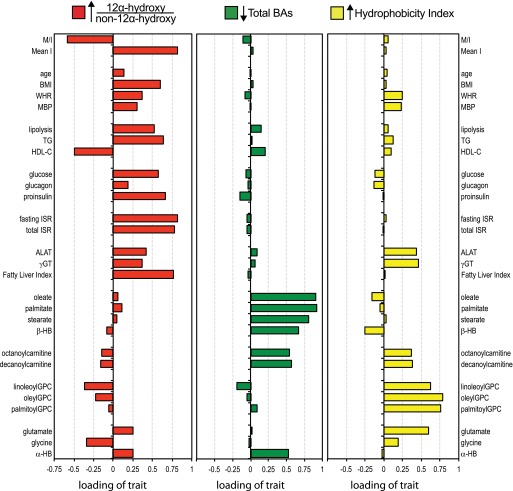
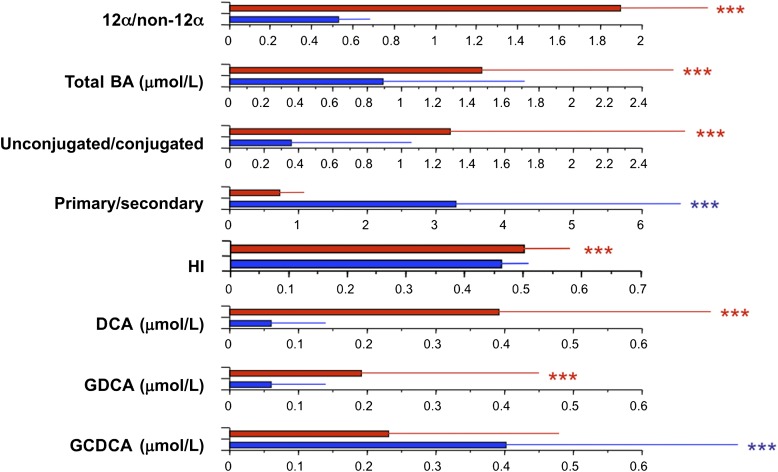
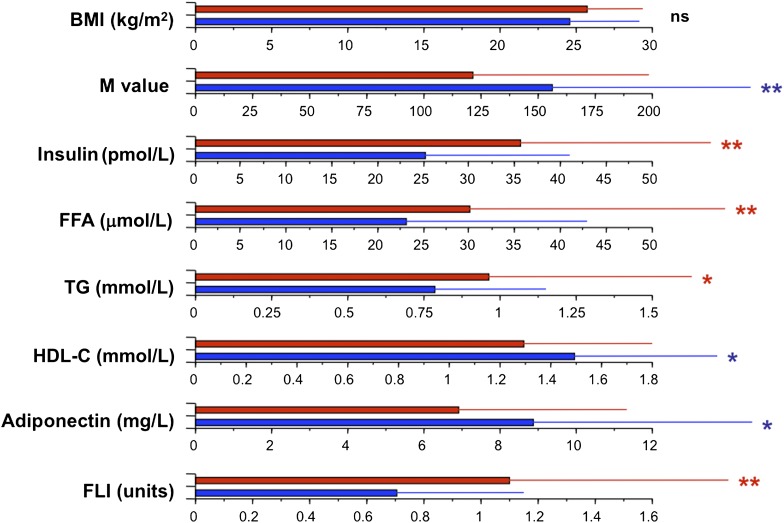
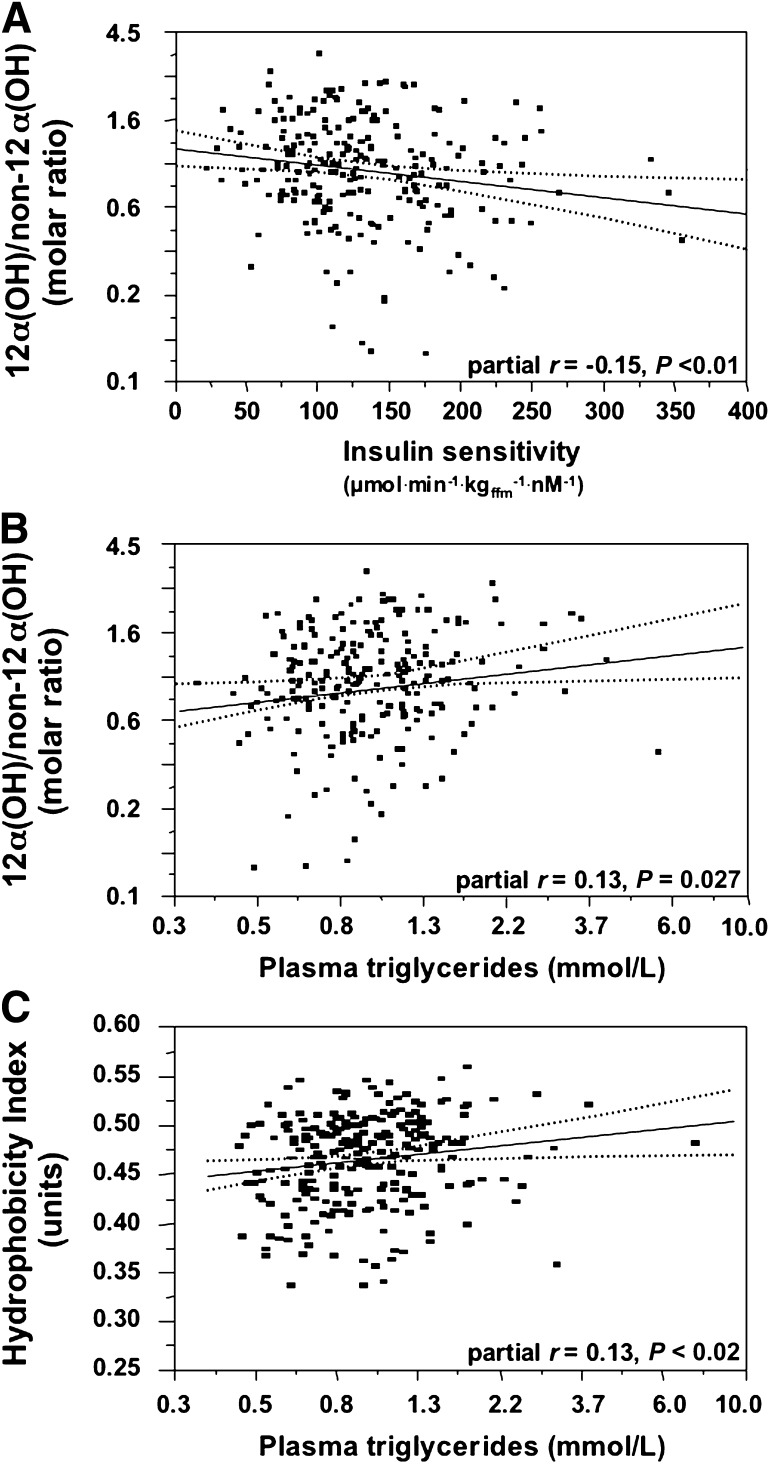
Bile acids (BAs) exert pleiotropic metabolic effects, and physicochemical properties of different BAs affect their function. In rodents, insulin regulates BA composition, in part by regulating the BA 12α-hydroxylase CYP8B1. However, it is unclear whether a similar effect occurs in humans. To address this question, we examined the relationship between clamp-measured insulin sensitivity and plasma BA composition in a cohort of 200 healthy subjects and 35 type 2 diabetic (T2D) patients. In healthy subjects, insulin resistance (IR) was associated with increased 12α-hydroxylated BAs (cholic acid, deoxycholic acid, and their conjugated forms). Furthermore, ratios of 12α-hydroxylated/non-12α-hydroxylated BAs were associated with key features of IR, including higher insulin, proinsulin, glucose, glucagon, and triglyceride (TG) levels and lower HDL cholesterol. In T2D patients, BAs were nearly twofold elevated, and more hydrophobic, compared with healthy subjects, although we did not observe disproportionate increases in 12α-hydroxylated BAs. In multivariate analysis of the whole dataset, controlling for sex, age, BMI, and glucose tolerance status, higher 12α-hydroxy/non-12α-hydroxy BA ratios were associated with lower insulin sensitivity and higher plasma TGs. These findings suggest a role for 12α-hydroxylated BAs in metabolic abnormalities in the natural history of T2D and raise the possibility of developing insulin-sensitizing therapeutics based on manipulations of BA composition.
Figures

Comment in
-
Soaping up type 2 diabetes with bile acids?: the link between glucose and bile acid metabolism in humans tightens: quality matters!Diabetes. 2013 Dec;62(12):3987-9. doi: 10.2337/db13-1278. Diabetes. 2013. PMID: 24264396 Free PMC article. No abstract available.
References
-
- Lefebvre P, Cariou B, Lien F, Kuipers F, Staels B. Role of bile acids and bile acid receptors in metabolic regulation. Physiol Rev 2009;89:147–191 - PubMed
-
- Gregor MF, Hotamisligil GS. Thematic review series: adipocyte biology. Adipocyte stress: the endoplasmic reticulum and metabolic disease. J Lipid Res 2007;48:1905–1914 - PubMed
-
- Paumgartner G, Beuers U. Ursodeoxycholic acid in cholestatic liver disease: mechanisms of action and therapeutic use revisited. Hepatology 2002;36:525–531 - PubMed
-
- Hofmann AF. The continuing importance of bile acids in liver and intestinal disease. Arch Intern Med 1999;159:2647–2658 - PubMed
Publication types
MeSH terms
Substances
Grants and funding
LinkOut - more resources
Full Text Sources
Other Literature Sources
Medical
Miscellaneous
