. 2013 Jul 24;33(30):12186-96.
doi: 10.1523/JNEUROSCI.0545-13.2013.

Type 1 inositol trisphosphate receptor regulates cerebellar circuits by maintaining the spine morphology of purkinje cells in adult mice

Affiliations

Type 1 inositol trisphosphate receptor regulates cerebellar circuits by maintaining the spine morphology of purkinje cells in adult mice

Takeyuki Sugawara et al. J Neurosci. .

Abstract

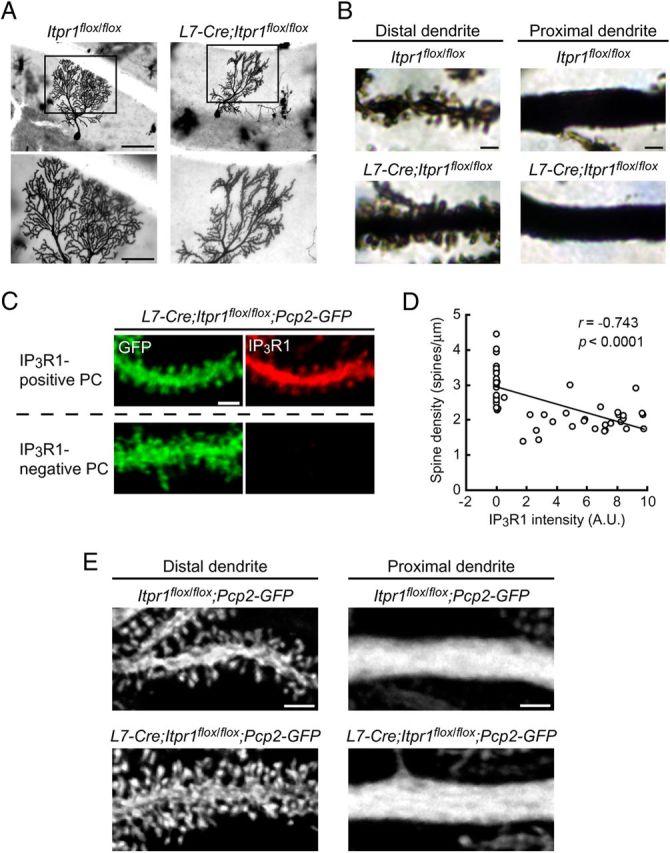
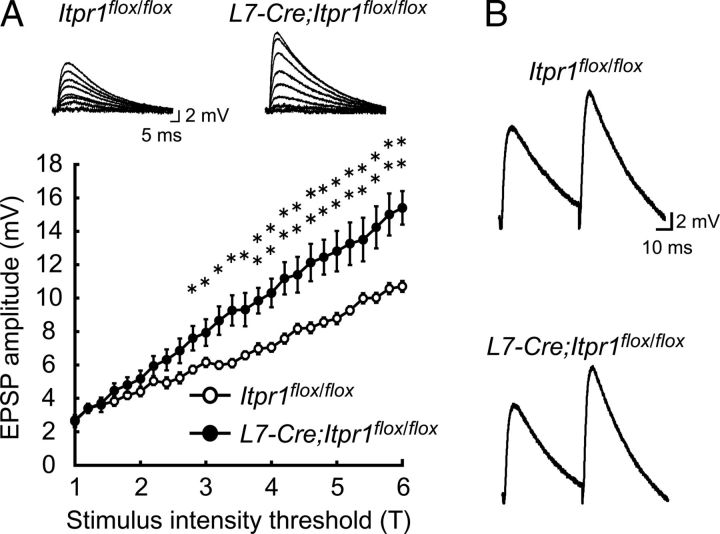
The structural maintenance of neural circuits is critical for higher brain functions in adulthood. Although several molecules have been identified as regulators for spine maintenance in hippocampal and cortical neurons, it is poorly understood how Purkinje cell (PC) spines are maintained in the mature cerebellum. Here we show that the calcium channel type 1 inositol trisphosphate receptor (IP3R1) in PCs plays a crucial role in controlling the maintenance of parallel fiber (PF)-PC synaptic circuits in the mature cerebellum in vivo. Significantly, adult mice lacking IP3R1 specifically in PCs (L7-Cre;Itpr1(flox/flox)) showed dramatic increase in spine density and spine length of PCs, despite having normal spines during development. In addition, the abnormally rearranged PF-PC synaptic circuits in mature cerebellum caused unexpectedly severe ataxia in adult L7-Cre;Itpr1(flox/flox) mice. Our findings reveal a specific role for IP3R1 in PCs not only as an intracellular mediator of cerebellar synaptic plasticity induction, but also as a critical regulator of PF-PC synaptic circuit maintenance in the mature cerebellum in vivo; this mechanism may underlie motor coordination and learning in adults.


Figures

Figure 1.
Figure 1.
Severe cerebellar ataxia in adult L7-Cre;Itpr1flox/flox mice. A, Schematic diagram of the procedure for generating floxed Itpr1 ES clones. Top, Wild-type Itpr1 locus. Open box indicates the exon 3 of Itpr1 in which the initiation ATG codon is localized. Middle, Targeting vector in which a loxP site was inserted at both sides of exon 3; a phosphogylcerol kinase-neo gene cassette and a diphtheria toxin A marker (DT) was inserted at the 5′ end at the exon 3. Bottom, Floxed Itpr1 locus with deleted neo cassette gene. Restriction enzyme abbreviations are as follows: E, EcoRI; S, SalI; B, BamHI; X, XbaI. B, Southern blot of genome digested with BamHI using a probe indicated in A. C, Genotyping of floxed Itpr1 by PCR. Asterisk indicates a hybrid product of PCR product derived from wild-type and floxed alleles. D, Representative footprints of Itpr1flox/flox and L7-Cre;Itpr1flox/flox mice at 4W, 5W, 6W, 7W, 8W, and 9W. The walking patterns were recorded from mice hindpaws. E, F, Quantitative analysis of footprint patterns for stride length (E) and base width (F) from Itpr1flox/flox (white circles) and L7-Cre;Itpr1flox/flox (black circles) mice at 4W, 5W, 6W, 7W, 8W, and 9W (n = 3 mice; **p < 0.01, ***p < 0.0001, t test and Mann–Whitney U test). n.d., Not determined.
Figure 2.
Figure 2.
Characterization of L7-Cre;Itpr1flox/flox mice. A, Immunohistochemical analysis of IP3R1 proteins in the cerebellum, cerebral cortex, and hippocampus. Sagittal sections prepared from control Itpr1flox/flox and L7-Cre;Itpr1flox/flox mice at 10W were stained with anti-IP3R1 antibody (4C11). Scale bars, 100 μm. B, Immunoblot analysis of IP3R1 proteins in the cerebral cortex and cerebellum. Membrane fractions prepared from cortex or cerebellum of Itpr1flox/flox and L7-Cre;Itpr1flox/flox mice at 8W were probed with the antibodies indicated. C, Immunohistochemical analysis of the expression level of IP3R1 protein in the cerebellar PCs at different ages. Sagittal sections prepared from Itpr1flox/flox and L7-Cre;Itpr1flox/flox mice at P15, P21, 6W, 8W, and 14W were stained with anti-IP3R1 antibody (4C11). Scale bar, 500 μm. D, Nissl staining of sagittal sections of the cerebellar vermis prepared from mice at 10W. The bottom panels show magnified views of the middle panels. Scale bars: top, 1 mm; middle, 500 μm; bottom, 50 μm. E, Immunostaining for calbindin of sagittal sections of the cerebellar vermis prepared from mice at 10W. Scale bar, 50 μm.
Figure 3.
Figure 3.
Abnormal PC dendritic and spine morphology from adult L7-Cre;Itpr1flox/flox mice. A, Golgi-stained PCs from Itpr1flox/flox and L7-Cre;Itpr1flox/flox mice at 10W. Low-magnification images (top) and magnified images (bottom) are shown. Scale bars: top, 100 μm; bottom, 50 μm. B, Higher-magnification views of distal dendritic (left) and proximal dendritic (right) regions of Golgi-stained PCs. Scale bars, 2 μm. C, Relationship between abnormal spine density and loss of IP3R1 in PCs of adult L7-Cre;Itpr1flox/flox mice. Cerebellar sagittal sections prepared from L7-Cre;Itpr1flox/flox mice at 10W were coimmunostained with anti-GFP (green) and anti-IP3R1 antibodies (4C11; red). Representative images of distal dendrites of IP3R1-positive (top panels) and IP3R1-negative (bottom panels) PCs located in lobule VI are shown. Scale bar, 2 μm. D, Plot of spine density along distal dendrites versus average fluorescence intensity for IP3R1 in distal dendrites in L7-Cre;Itpr1flox/flox;Pcp2-GFP mice. Each circle represents a single neuron. The black line is plotted by linear regression (n = 53 neurons from two mice; r = −0.743, p < 0.0001, Spearman correlation analysis). A.U., Arbitrary units. E, Spines on distal (left) and proximal (right) dendrites of PCs expressing GFP in Itpr1flox/flox;Pcp2-GFP and L7-Cre;Itpr1flox/flox;Pcp2-GFP mice at 10W. Scale bars, 2 μm.
Figure 4.
Figure 4.
Formation of PF–PC and CF–PC synapses in adult L7-Cre;Itpr1flox/flox mice. A, Immunohistochemical analysis of PF innervation on PC distal dendritic spines in Itpr1flox/flox;Pcp2-GFP and L7-Cre;Itpr1flox/flox;Pcp2-GFP mice at 10W. Sagittal cerebellar sections were coimmunostained with anti-GFP (green) and anti-VGluT1 antibodies (blue). Representative images of PC distal dendritic region are shown. Scale bar, 5 μm. B, Immunohistochemical analysis of CF innervation on PCs in Itpr1flox/flox and L7-Cre;Itpr1flox/flox mice at 10W. Sagittal cerebellar sections were coimmunostained with anti-calbindin (green) and anti-VGluT2 antibodies (red). Representative images are shown. Dotted lines indicate the pial surface. Scale bar, 20 μm. C, Ultrastructure of the molecular layer of the cerebellum in Itpr1flox/flox and L7-Cre;Itpr1flox/flox mice at 10W. Spines containing PSD (S), PF presynaptic terminals containing active zone and synaptic vesicles (P), and PC dendrites (d) are indicated. Scale bar, 1 μm.
Figure 5.
Figure 5.
Formation of functional PF–PC synapse in adult L7-Cre;Itpr1flox/flox mice. A, Averaged input–output relationship of PF-EPSPs in acute cerebellar slices from 9- to 10-week-old Itpr1flox/flox and L7-Cre;Itpr1flox/flox mice. Plot of EPSP amplitude versus the T from Itpr1flox/flox (white circles) and L7-Cre;Itpr1flox/flox (black circles) mice are shown (Itpr1flox/flox, n = 6 neurons from three mice; L7-Cre;Itpr1flox/flox, n = 8 neurons from three mice; *p < 0.05, **p < 0.01, t test). Insets show representative EPSP traces evoked by PF stimuli of different intensities. B, The PPF ratio of the PF-EPSPs from acute cerebellar slices from 9- to 10-week-old Itpr1flox/flox or L7-Cre;Itpr1flox/flox mice. Representative EPSP traces evoked by PF stimuli at interpulse intervals of 50 ms are shown.
Figure 6.
Figure 6.
Lack of cerebellar LTD in L7-Cre;Itpr1flox/flox mice. A, Averaged time course of LTD induced by conjunctive stimulation of double-shock PF stimulation (2PF) and CF stimulation (CF) from Itpr1flox/flox (white circles) and L7-Cre;Itpr1flox/flox (black circles) mice at 10W. Rising slopes of PF-EPSPs relative to average baseline values during the 5 min preconjunction period are shown. The obliquely shaded band indicates period of conjunction. LTD magnitude, the average decrease in PF-EPSP slopes at 41–50 min, was used for statistical analysis (Itpr1flox/flox, n = 6 neurons from four mice; L7-Cre;Itpr1flox/flox, n = 6 neurons from six mice; p < 0.05, t test). Inset shows superimposed PF-EPSP traces recorded before (gray line) and after (black line) conjunctive stimulation. B, Averaged time course of LTD induced by conjunctive stimulation of 2PF and membrane depolarization (DEPO) from Itpr1flox/flox (white circles) and L7-Cre;Itpr1flox/flox (black circles) mice at 10W (Itpr1flox/flox, n = 7 neurons from six mice; L7-Cre;Itpr1flox/flox, n = 6 neurons from six mice; p < 0.05, t test). Inset shows superimposed PF-EPSP traces recorded before (gray line) and after (black line) conjunctive stimulation.
Figure 7.
Figure 7.
Characteristics of eye movements in L7-Cre;Itpr1flox/flox mice. A, Immunohistochemical analysis of IP3R1 protein in the cerebellar flocculus (FL). Coronal sections prepared from Itpr1flox/flox and L7-Cre;Itpr1flox/flox mice at 10W were stained with anti-IP3R1 (4C11, red) and anti-calbindin (green) antibodies and DAPI (blue). Scale bar, 500 μm. B, Nissl staining of coronal sections of cerebellar flocculus prepared from Itpr1flox/flox and L7-Cre;Itpr1flox/flox mice at 10W. Bottom panels show a magnified view of the top panels. Scale bars: top, 500 μm; bottom, 100 μm. C, HOKR gain of Itpr1flox/flox (white bars) and L7-Cre;Itpr1flox/flox (black bars) mice at 10W. HOKR was measured by sinusoidal screen oscillation at 5–20° (peak-to-peak) and 0.11–0.17 Hz (maximum screen velocity, 2.6–10.5°/s) in the light (Itpr1flox/flox, n = 13 mice; L7-Cre;Itpr1flox/flox, n = 5 mice; two-way repeated-measures ANOVA). p value is shown in the panel.
Figure 8.
Figure 8.
Lack of HOKR adaptation in L7-Cre;Itpr1flox/flox mice. A, Examples of eye movement traces at 0 h (dashed lines) and after 1 h (solid lines) of sustained screen oscillation (15° at 0.17 Hz) in Itpr1flox/flox (top) and L7-Cre;Itpr1flox/flox (middle) mice at 10W. Averaged traces of eye position obtained from >10 cycles of screen oscillation are shown. The trace of screen position is shown in the bottom panel. B, The mean HOKR gain changes during 1 h of sustained screen oscillation of Itpr1flox/flox (white bar) and L7-Cre;Itpr1flox/flox (black bar) at 10W. HOKR gain change was defined as the HOKR gain at 1 h − HOKR gain at 0 h (n = 7 mice; Mann–Whitney U test). p value is shown in the panel.

References

    1. Aiba A, Kano M, Chen C, Stanton ME, Fox GD, Herrup K, Zwingman TA, Tonegawa S. Deficient cerebellar long-term depression and impaired motor learning in mGluR1 mutant mice. Cell. 1994;79:377–388. doi: 10.1016/0092-8674(94)90205-4. - DOI - PubMed
    1. Arshavsky YI, Gelfand IM, Orlovsky GN. The cerebellum and control of rhythmical movements. Trends Neurosci. 1983;6:417–422. doi: 10.1016/0166-2236(83)90191-1. - DOI
    1. Barski JJ, Dethleffsen K, Meyer M. Cre recombinase expression in cerebellar Purkinje cells. Genesis. 2000;28:93–98. doi: 10.1002/1526-968X(200011/12)28:3/4<93::AID-GENE10>3.0.CO;2-W. - DOI - PubMed
    1. Berridge MJ, Lipp P, Bootman MD. The versability and universality of calcium signaling. Nat Rev Mol Cell Biol. 2000;1:11–21. doi: 10.1038/35036035. - DOI - PubMed
    1. Black JE, Isaacs KR, Anderson BJ, Alcantara AA, Greenough WT. Learning causes synaptogenesis, whereas motor activity causes angiogenesis, in cerebellar cortex of adult rats. Proc Natl Acad Sci U S A. 1990;87:5568–5572. doi: 10.1073/pnas.87.14.5568. - DOI - PMC - PubMed

Publication types

MeSH terms

Substances

LinkOut - more resources