. 2013 Jul 24;33(30):12242-54.
doi: 10.1523/JNEUROSCI.5736-12.2013.

Slit/Robo signaling mediates spatial positioning of spiral ganglion neurons during development of cochlear innervation

Affiliations

Slit/Robo signaling mediates spatial positioning of spiral ganglion neurons during development of cochlear innervation

Sheng-zhi Wang et al. J Neurosci. .

Abstract

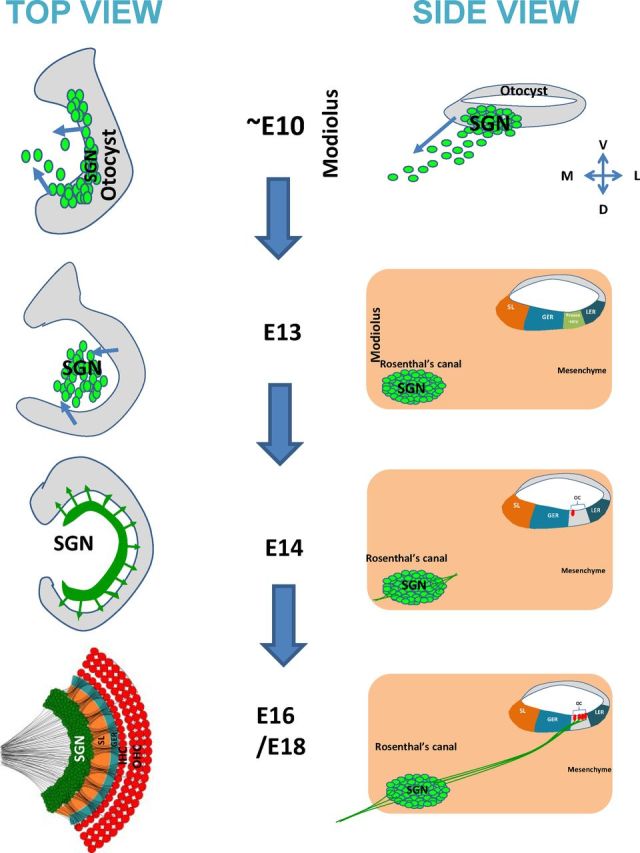
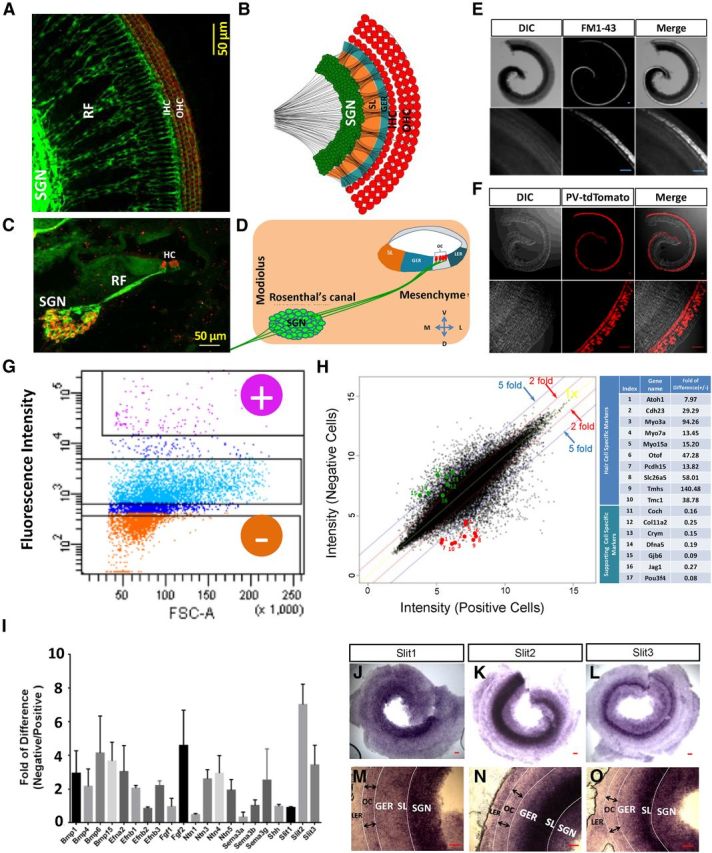
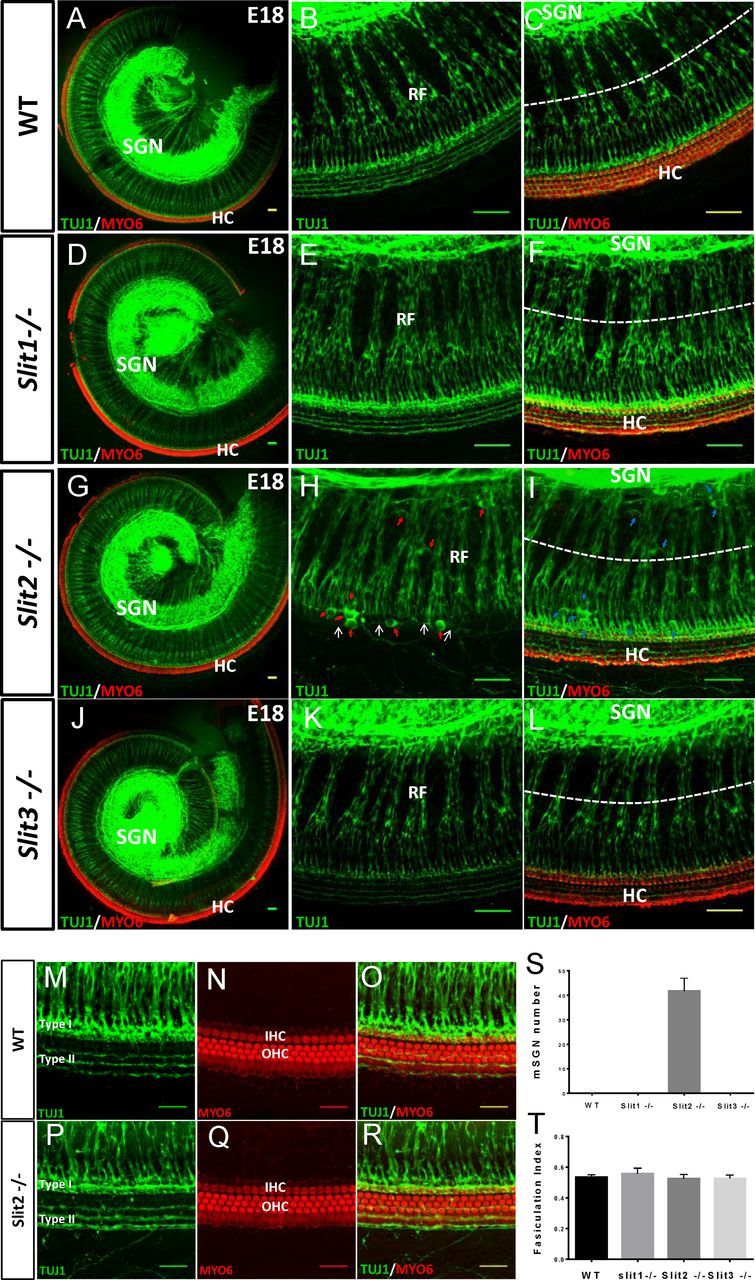
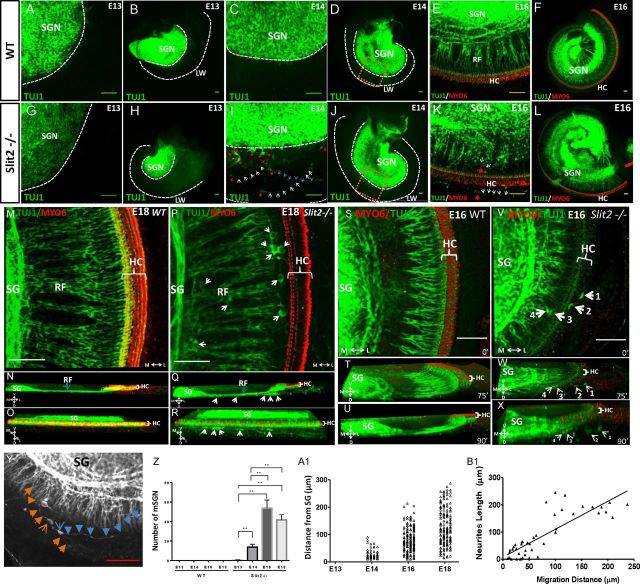
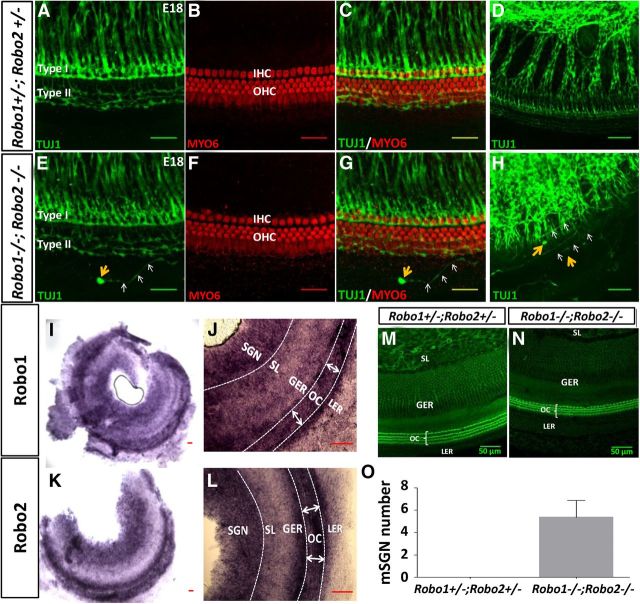
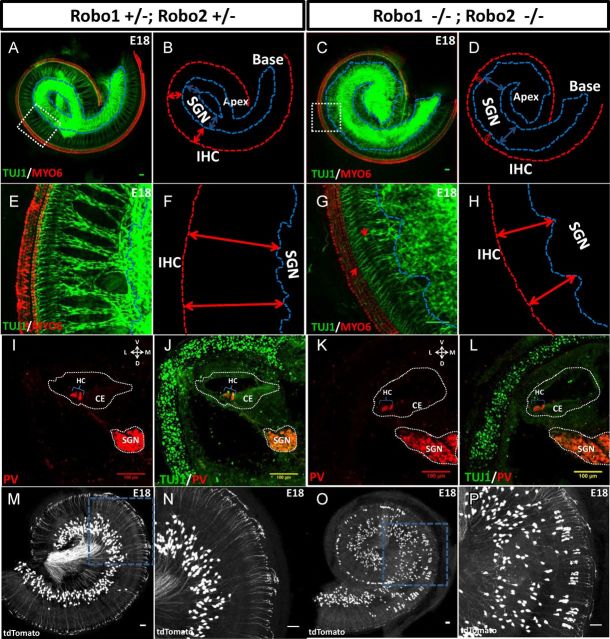
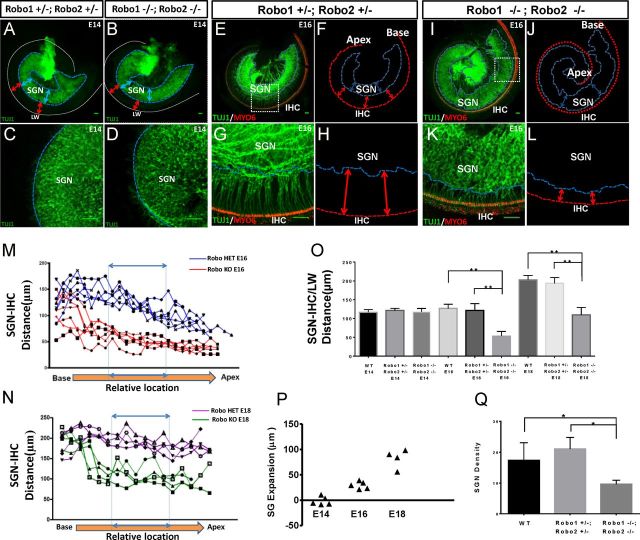
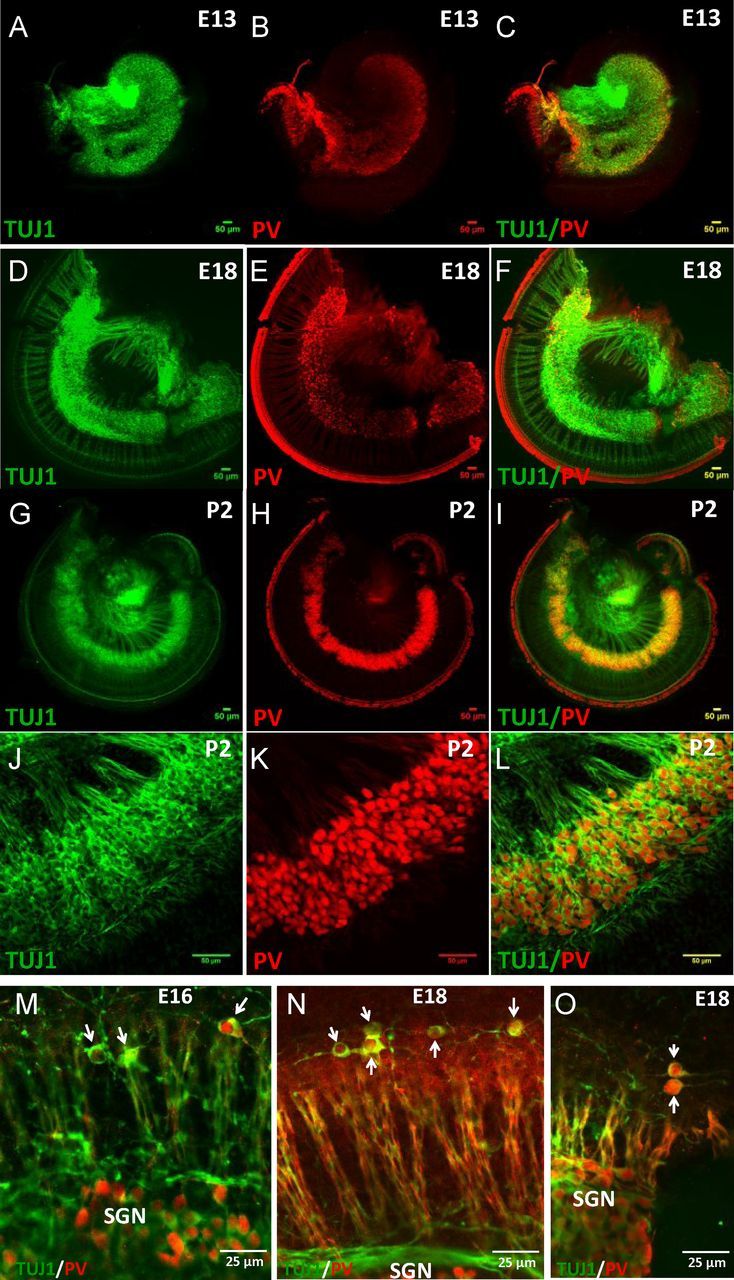
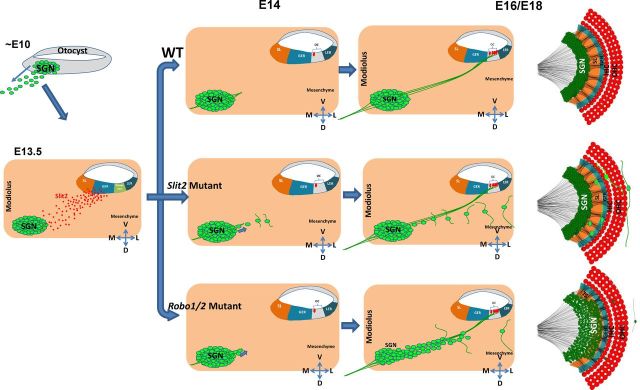
During the development of periphery auditory circuits, spiral ganglion neurons (SGNs) extend their neurites to innervate cochlear hair cells (HCs) with their soma aggregated into a cluster spatially segregated from the cochlear sensory epithelium. The molecular mechanisms underlying this spatial patterning remain unclear. In this study, in situ hybridization in the mouse cochlea suggests that Slit2 and its receptor, Robo1/2, exhibit apparently complementary expression patterns in the spiral ganglion and its nearby region, the spiral limbus. In Slit2 and Robo1/2 mutants, the spatial restriction of SGNs was disrupted. Mispositioned SGNs were found to scatter in the space between the cochlear epithelium and the main body of spiral ganglion, and the neurites of mispositioned SGNs were misrouted and failed to innervate HCs. Furthermore, in Robo1/2 mutants, SGNs were displaced toward the cochlear epithelium as an entirety. Examination of different embryonic stages in the mutants revealed that the mispositioning of SGNs was due to a progressive displacement to ectopic locations after their initial normal settlement at an earlier stage. Our results suggest that Slit/Robo signaling imposes a restriction force on SGNs to ensure their precise positioning for correct SGN-HC innervations.


Figures

Figure 1.
Figure 1.
Schematic illustration of the assembly of peripheral auditory circuitry. Early in development (∼E10), SGNs delaminate from the developing otocyst and coalesce to form a tight cluster in the Rosenthal's canal close to the modiolus by E13. SGNs subsequently extend their peripheral neurites (starting from E14) to innervate HCs located in the organ of Corti (OC) at the cochlear epithelium while their somas are restricted within the Rosenthal's canal, forming topographically organized connectivity.
Figure 2.
Figure 2.
Gene expression analysis to identify Slit molecules as candidates to regulate the spatial patterning of SGNs. A–D, The SGN-HC innervation pattern at P1. A, B, Top view. C, D, Cross-section view. Green, TUJ1 staining; red, Myo6 staining in A and PV staining in C. B and D indicate that SGN somas are restricted in the Rosenthal's canal while their peripheral axons penetrate through the otic mesenchyme and GER to innervate HCs (red) in the organ of Corti (OC). LER, Lesser epithelial ridge (or outer sulcus). E, Differential interference contrast (DIC) and fluorescence images of a wild-type cochlea at P6 stained with the styryl dye FM1-43. Top, Whole cochlea. Bottom, Higher-magnification images. Scale bar: 50 μm. F, Images of a cochlea of a PV-Cre; Ai14 mouse at P6. Scale bar, 50 μm. G, Gating configuration of FACS for separating HCs (fluorescence-positive population as marked by “+”) from other cochlear cells (negative population as marked by “−”) based on fluorescence intensity. H, Plot of the expression value of individual probes in the negative cell population versus positive cell population. Fold difference of 1×, 2×, and 5× is marked by the yellow, red, and blue line respectively. Selected HC-specific genes (1–10 in the table) and supporting cell-specific genes (11–17 in the table) are highlighted by the red and green circles respectively. I, Fold of difference between the negative and positive cell populations for selected axon guidance molecules and morphogens in the microarray analysis. N = 3. Bar = SD. J–O, In situ hybridization of Slit1 (J, M), Slit2 (K, N), and Slit3 (L, O) molecules in the whole-mount cochlea at E16. M–O are higher-magnification images of J–L respectively. Scale bar, 50 μm.
Figure 3.
Figure 3.
Mispositioned SGNs in the Slit2 mutant cochlea at E18. A–L, Representative images of SGN (green, TUJ1 staining) innervation of HCs (red, Myo6 staining) in the whole-mount cochlea of wild-type, Slit1−/−, Slit2−/−, and Slit3−/− embryos, as labeled. Images in middle and right panels are higher-magnification images, representing TUJ1 staining and superimposed TUJ1 and Myo6 staining respectively. Note that H is the projection of a subset of z-stack images, not including HC layers to show more clearly the mispositioned SGNs (mSGNs), while the other images are the projections of the complete z-stack images. Red and blue arrows (in H and I respectively) point to the mSGNs in the Slit2−/− cochlea, and white arrows (in H) point to the misrouted neurites originated from the mSGNs. Scale bar, 50 μm. Enlarged images were taken with a 40× oil objective (numerical aperture 1.30). M–O, Example images of SGN fibers (green) and HCs (red) and their superimposed image of a wild-type cochlea. P–R, example images of a Slit2−/− cochlea. Scale bar, 25 μm. S, Average number of mSGNs per cochlea for wild-type and different Slit mutant mice. Bar = SD. N = 6 embryos for all genotypes. T, Average fasciculation index (quantified as the ratio of the total thickness of RF bundles over the total width along the white dotted line shown in C, F, I, and L. Bar = SD. N = 6 embryos for all genotypes.
Figure 4.
Figure 4.
Developmental changes of SGN positioning in the Slit2 mutant cochlea. A–L, Representative images of SGN positioning in wild-type (A–F) and Slit2−/− (G–L) embryos at E13, E14, and E16 as labeled. Both the whole-mount cochleae (B, D, F, H, J, L) and high magnification of their local regions (A, C, E, G, I, K) are shown. White dotted lines mark the lateral boundary of the SGN cluster and the cochlear lateral wall (LW). Red arrows in I and K mark the mispositioned SGN (mSGN) soma, and white and blue arrows point to the misrouted neurites originated from these neurons. Scale bar, 50 μm. M–X, 3D reconstruction of images from the wild-type and Slit2−/− cochleae at E18 and E16. M–O, Top, transverse, and sagittal views of the same 3D image of an E18 cochlea. S–U: Top view, 75° and 90° turning transverse view. P–R and V–X are presented similarly as M–O and S–U, respectively. VX, 3D reconstruction from a subset of z-stack images (not including the majority of HC layers) to better illustrate the cell body positions of the mSGNs. White arrows in P–R and VX mark the mSGNs in Slit2−/− cochlea visualized from different angles. The same numbers in V–X represent the same mSGNs. Note that the mSGNs and their processes were located dorsal to the organ of Corti (marked by HCs). Scale bar, 50 μm. Y, High-magnification image of V to show the misrouted neurites of cell 1 (blue arrows) and 2 (orange arrows) in V–X. Scale bar, 50 μm. Z, Average number of mSGNs per cochlea in Slit2 mutant and their wild-type littermates at different developmental stages. N = 4, 5, 5, 6, 4, 4, 6, 6 embryos for the genotypes listed from left to right respectively. Bar = SD. **p < 0.01, one-way ANOVA with Tukey's multiple-comparisons test. A1, Plot of the migration distance of individual mSGNs from the SG in Slit2−/− cochleae at different developmental stages. Triangles arranged in the same column represent individual cells from the same cochlea. B1, Scatter plot of the neurite length of the mSGNs against the migration distance of their soma from the SG. The best-fit linear regression line is shown.
Figure 5.
Figure 5.
Individually mislocated SGNs in the Robo1/2 mutant. A–H, Images of SGN projections and HCs of two whole-mount cochlea with different genotypes as labeled at E18. D and H are independent examples from AC and EG, respectively. Yellow arrows in G and H mark the soma of the individually mispositioned SGN (mSGN). Scale bars: AC, E–G, 50 μm; D, H, 25 μm. H is a projection of a subset of z-stack images while AG are projections of the complete image series. I–L, In situ hybridization of Robo1 and Robo2 in the whole mount-cochlea at E16. J and L are higher magnifications of the cochleae shown in I and K, respectively. Double arrowheads in J and L mark the boundary of the organ of Corti (OC). Scale bar, 50 μm. M, N, Top views of the whole-mount cochlea stained with Alexa-488-conjugated phalloidin from a Robo1−/−; Robo2−/− (N) embryo and its Robo1+/−; Robo2+/− (M) littermate at E18. O, Average number of mSGNs per cochlea at E18. N = 4 embryos for both genotypes.
Figure 6.
Figure 6.
Expansion of SG territory in the Robo1/2 mutant. A–H, Representative images of the whole-mount cochleae from Robo1+/−; Robo2+/− and Robo1−/−; Robo2−/− embryos at E18. The red lines with double arrowheads illustrate the distance between the lateral SGN boundary and inner HCs (SGN–IHC distance). The blue lines and double arrowheads illustrate the SGN boundary and its width respectively. E–H, High-magnification images of A–D. Scale bar, 50 μm. I–L, Representative images of cross sections of cochleae from Robo1+/−; Robo2+/− (I, J) and Robo1−/−; Robo2−/− (K, L) embryos at E16. White dotted curves mark the boundaries of the SG (SGN) and cochlear epithelium (CE). M–P, Representative whole-mount images and their enlarged view (right) of sparsely labeled SGNs (by tdTomato expression) distributed in E18 cochleae from Robo1+/−; Robo2+/− (M, N) and Robo1−/−; Robo2−/− (O, P) mice, which carried Neurogenin1-CreERT2 and Ai14 alleles. Scale bar, 50 μm.
Figure 7.
Figure 7.
SG territory progressively expands toward the cochlear epithelium in the Robo1/2 mutant. A–L, Representative images of cochleae from Robo1+/−; Robo2+/− and Robo1−/−; Robo2−/− embryos at E14 (A–D) and E16 (E–L) respectively. Labels are applied in a similar way as in Figure 6. Scale bar, 50 μm. M, N, Plot of SGN–IHC distance along the base–apex axis of the cochlea for selected Robo1−/−; Robo2−/− mutants (M, red; N, green) and their Robo1+/−; Robo2+/− littermates (M, blue; N, purple) at E16 (M) and E18 (N). O, Average SGN–LW distance (at E14) or SGN–IHC distance (at E16 and E18) in the middle part of the cochlea for Robo1/2 mutants, and their heterozygous and wild-type littermates. N = 5 embryos for all genotypes at E14 and E16, N = 4 for all genotypes at E18. Bar = SD. **p < 0.01, one-way ANOVA with Tukey's multiple-comparisons test. P, Quantification of SG expansion in the Robo1/2 double mutant at different developmental stages (see Materials and Methods for details). Each triangle represents the average expansion distance for a single mutant cochlea as normalized to the wild-type tissue. Q, Average SGN density as quantified by the number of SGNs per 10,000 μm2 in wild-type and Robo mutant embryos at E18. N = 4 embryos for all genotypes. Bar = SD. *p < 0.05, one-way ANOVA with Tukey's multiple-comparison test.
Figure 8.
Figure 8.
Mispositioned neurons as revealed by PV staining in the Slit2 mutant. A–I, Representative images of whole-mount cochleae from wild-type embryos stained with TUJ1 (green) and PV (red) antibodies at E13 (A–C), E18 (D–F), and P2 (G–L). J–L, Enlarged views of SGNs in G–I. Note that SGNs express PV. Scale bar, 50 μm. M–O, Representative images of Slit2−/− cochleae at E16 (M) and E18 (N, O). White arrows point to the mispositioned SGNs, which were positive for both TUJ1 and PV staining. Scale bar, 25 μm.
Figure 9.
Figure 9.
A proposed model for Slit/Robo signaling in restricting SGN positioning. Early in development (∼E10), SGNs delaminate from the otocyst, migrate toward the modiolus, and settle down in the Rosenthal's canal by E13.5. Subsequently, SGNs extend their peripheral axons toward the organ of Corti (OC) at E14 and begin to form synaptic connections with HCs at E16. The SGN somas are restrained within the Rosenthal's canal during the formation of SGN-HC innervations in the wild-type cochlea. Slit2 (and possibly Slit3) secreted from the SL and GER regions acts on Robo receptors expressed in SGNs and provides the restriction force to restrain SGNs from migrating toward the cochlear epithelium. In the Slit2 mutant cochlea, a number of SGNs disperse from the Rosenthal's canal progressively and were eventually located in the space dorsal to the cochlear epithelium. During this process, their neurites progressively extend out from the soma and largely travel along the longitudinal direction and appear not to innervate HCs. In the Robo mutant, a small number of SGNs are scattered dorsal to the cochlear epithelium similarly as in the Slit2 mutant. In addition, the entire SGN territory expands progressively toward the cochlear epithelium starting from E14, resulting in a shorter SGN–HC distance as well as a broader SGN width. The more severe defect in the Robo mutant compared with the Slit2 mutant suggests that additional factors act synergistically with Slit2 on Robo receptors to restrict the SGN soma within the Rosenthal's canal, which is essential for the formation of precise patterning of SGN–HC connections.

References

    1. Appler JM, Goodrich LV. Connecting the ear to the brain: Molecular mechanisms of auditory circuit assembly. Prog Neurobiol. 2011;93:488–508. doi: 10.1016/j.pneurobio.2011.01.004. - DOI - PMC - PubMed
    1. Battisti AC, Fekete DM. Slits and Robos in the developing chicken inner ear. Dev Dyn. 2008;237:476–484. doi: 10.1002/dvdy.21429. - DOI - PMC - PubMed
    1. Bolstad BM, Irizarry RA, Astrand M, Speed TP. A comparison of normalization methods for high density oligonucleotide array data based on variance and bias. Bioinformatics. 2003;19:185–193. doi: 10.1093/bioinformatics/19.2.185. - DOI - PubMed
    1. Borrell V, Cárdenas A, Ciceri G, Galcerán J, Flames N, Pla R, Nóbrega-Pereira S, García-Frigola C, Peregrín S, Zhao Z, Ma L, Tessier-Lavigne M, Marín O. Slit/Robo signaling modulates the proliferation of central nervous system progenitors. Neuron. 2012;76:338–352. doi: 10.1016/j.neuron.2012.08.003. - DOI - PMC - PubMed
    1. Brose K, Bland KS, Wang KH, Arnott D, Henzel W, Goodman CS, Tessier-Lavigne M, Kidd T. Slit proteins bind Robo receptors and have an evolutionarily conserved role in repulsive axon guidance. Cell. 1999;96:795–806. doi: 10.1016/S0092-8674(00)80590-5. - DOI - PubMed

Publication types

MeSH terms

Substances

LinkOut - more resources