

Contribution of pannexin1 to experimental autoimmune encephalomyelitis
- PMID: 23885286
- PMCID: PMC3688586
- DOI: 10.1371/journal.pone.0066657
Contribution of pannexin1 to experimental autoimmune encephalomyelitis
Abstract
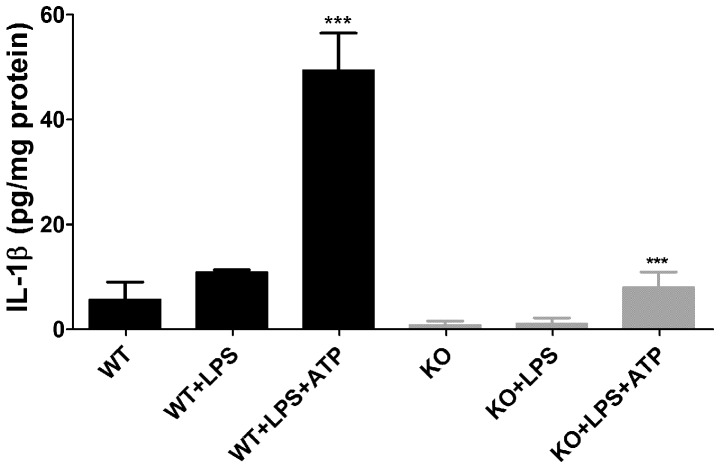
Pannexin1 (Panx1) is a plasma membrane channel permeable to relatively large molecules, such as ATP. In the central nervous system (CNS) Panx1 is found in neurons and glia and in the immune system in macrophages and T-cells. We tested the hypothesis that Panx1-mediated ATP release contributes to expression of Experimental Autoimmune Encephalomyelitis (EAE), an animal model for multiple sclerosis, using wild-type (WT) and Panx1 knockout (KO) mice. Panx1 KO mice displayed a delayed onset of clinical signs of EAE and decreased mortality compared to WT mice, but developed as severe symptoms as the surviving WT mice. Spinal cord inflammatory lesions were also reduced in Panx1 KO EAE mice during acute disease. Additionally, pharmacologic inhibition of Panx1 channels with mefloquine (MFQ) reduced severity of acute and chronic EAE when administered before or after onset of clinical signs. ATP release and YoPro uptake were significantly increased in WT mice with EAE as compared to WT non-EAE and reduced in tissues of EAE Panx1 KO mice. Interestingly, we found that the P2X7 receptor was upregulated in the chronic phase of EAE in both WT and Panx1 KO spinal cords. Such increase in receptor expression is likely to counterbalance the decrease in ATP release recorded from Panx1 KO mice and thus contribute to the development of EAE symptoms in these mice. The present study shows that a Panx1 dependent mechanism (ATP release and/or inflammasome activation) contributes to disease progression, and that inhibition of Panx1 using pharmacology or gene disruption delays and attenuates clinical signs of EAE.
Conflict of interest statement
Figures


Similar articles
-
Pannexin 1 involvement in bladder dysfunction in a multiple sclerosis model.Sci Rep. 2013;3:2152. doi: 10.1038/srep02152. Sci Rep. 2013. PMID: 23827947 Free PMC article.
-
Neuronal Panx1 drives peripheral sensitization in experimental plantar inflammatory pain.Mil Med Res. 2024 Apr 29;11(1):27. doi: 10.1186/s40779-024-00525-8. Mil Med Res. 2024. PMID: 38685116 Free PMC article.
-
TRPM2 Exacerbates Central Nervous System Inflammation in Experimental Autoimmune Encephalomyelitis by Increasing Production of CXCL2 Chemokines.J Neurosci. 2018 Sep 26;38(39):8484-8495. doi: 10.1523/JNEUROSCI.2203-17.2018. Epub 2018 Sep 10. J Neurosci. 2018. PMID: 30201769 Free PMC article.
-
Pannexin: from discovery to bedside in 11±4 years?Brain Res. 2012 Dec 3;1487:150-9. doi: 10.1016/j.brainres.2012.04.058. Epub 2012 Jul 4. Brain Res. 2012. PMID: 22771709 Free PMC article. Review.
-
The role of pannexin1 in the induction and resolution of inflammation.FEBS Lett. 2014 Apr 17;588(8):1416-22. doi: 10.1016/j.febslet.2014.03.009. Epub 2014 Mar 15. FEBS Lett. 2014. PMID: 24642372 Free PMC article. Review.
Cited by
-
Endothelial Wnt/β-catenin signaling reduces immune cell infiltration in multiple sclerosis.Proc Natl Acad Sci U S A. 2017 Feb 14;114(7):E1168-E1177. doi: 10.1073/pnas.1609905114. Epub 2017 Jan 30. Proc Natl Acad Sci U S A. 2017. PMID: 28137846 Free PMC article.
-
Efferocytosis in the Central Nervous System.Front Cell Dev Biol. 2021 Dec 3;9:773344. doi: 10.3389/fcell.2021.773344. eCollection 2021. Front Cell Dev Biol. 2021. PMID: 34926460 Free PMC article. Review.
-
Do not let death do us part: 'find-me' signals in communication between dying cells and the phagocytes.Cell Death Differ. 2016 Jun;23(6):979-89. doi: 10.1038/cdd.2016.13. Epub 2016 Feb 19. Cell Death Differ. 2016. PMID: 26891690 Free PMC article. Review.
-
Pannexin 1 as a driver of inflammation and ischemia-reperfusion injury.Purinergic Signal. 2021 Dec;17(4):521-531. doi: 10.1007/s11302-021-09804-8. Epub 2021 Jul 12. Purinergic Signal. 2021. PMID: 34251590 Free PMC article. Review.
-
Central nervous system myeloid cells as drug targets: current status and translational challenges.Nat Rev Drug Discov. 2016 Feb;15(2):110-24. doi: 10.1038/nrd.2015.14. Epub 2015 Dec 4. Nat Rev Drug Discov. 2016. PMID: 26634996 Review.
References
-
- Frohman EM, Racke MK, Raine CS (2006) Multiple Sclerosis - The plaque and its pathogenesis. N Engl J Med 354: 942–955. - PubMed
-
- Compston A, Coles A (2008) Multiple sclerosis. Lancet 372: 1502–1517. - PubMed
-
- Domercq M, Perez-Samartin A, Aparicio D, Alberdi E, Pampliega O, Matute C (2010) P2X7 receptors mediate ischemic damage to oligodendrocytes. Glia 58: 730–740. - PubMed
Publication types
MeSH terms
Substances
Grants and funding
LinkOut - more resources
Full Text Sources
Other Literature Sources
Molecular Biology Databases
Research Materials
