. 2013 Aug;183(2):576-91.
doi: 10.1016/j.ajpath.2013.04.023.

Milky spots promote ovarian cancer metastatic colonization of peritoneal adipose in experimental models

Affiliations

Milky spots promote ovarian cancer metastatic colonization of peritoneal adipose in experimental models

Robert Clark et al. Am J Pathol. 2013 Aug.

Abstract

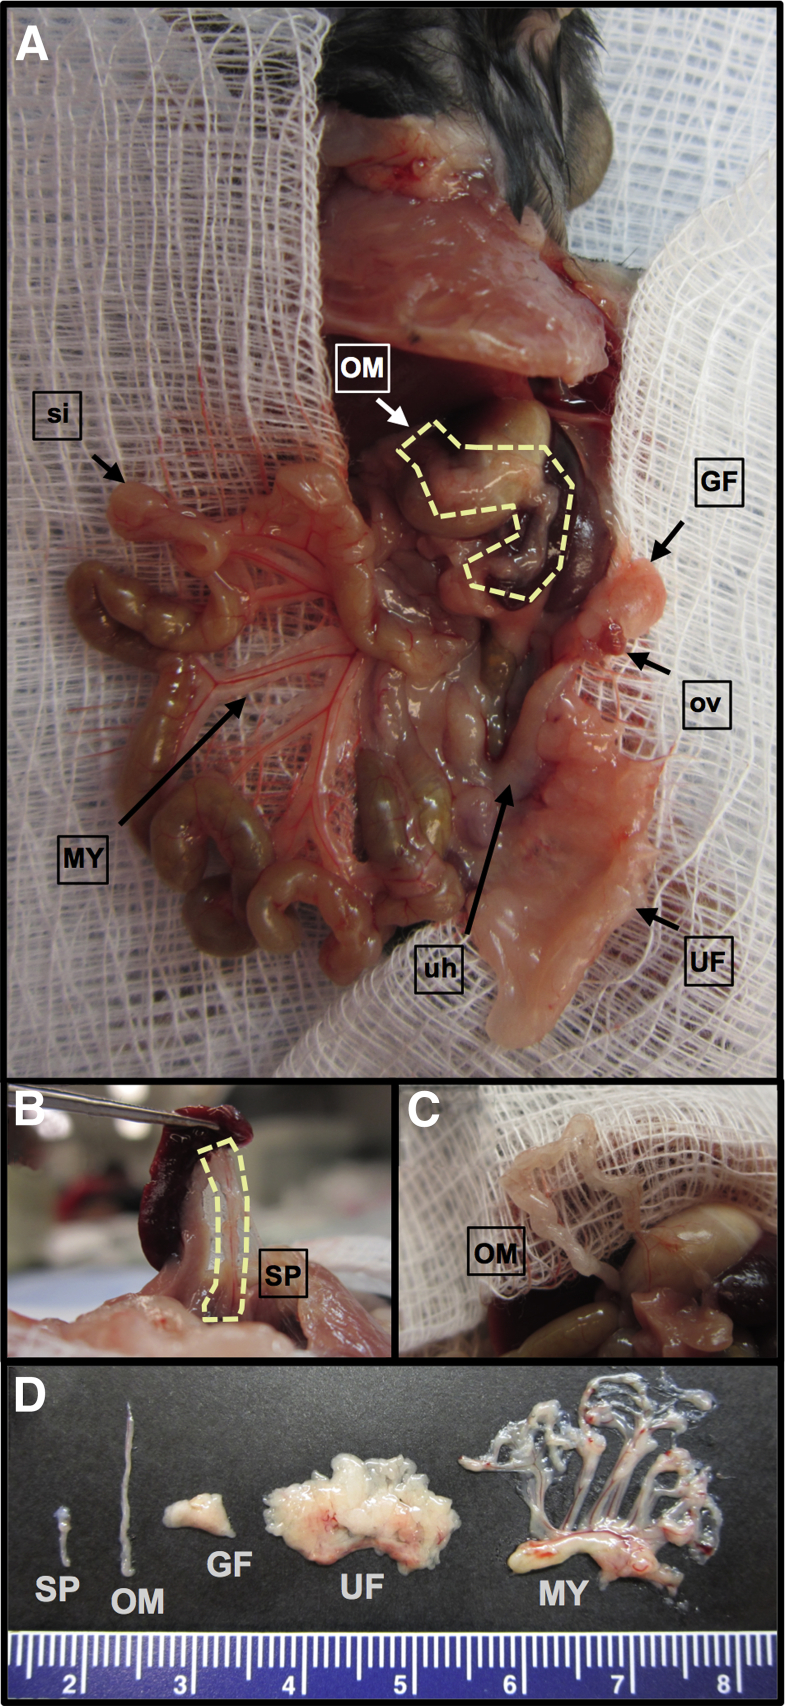
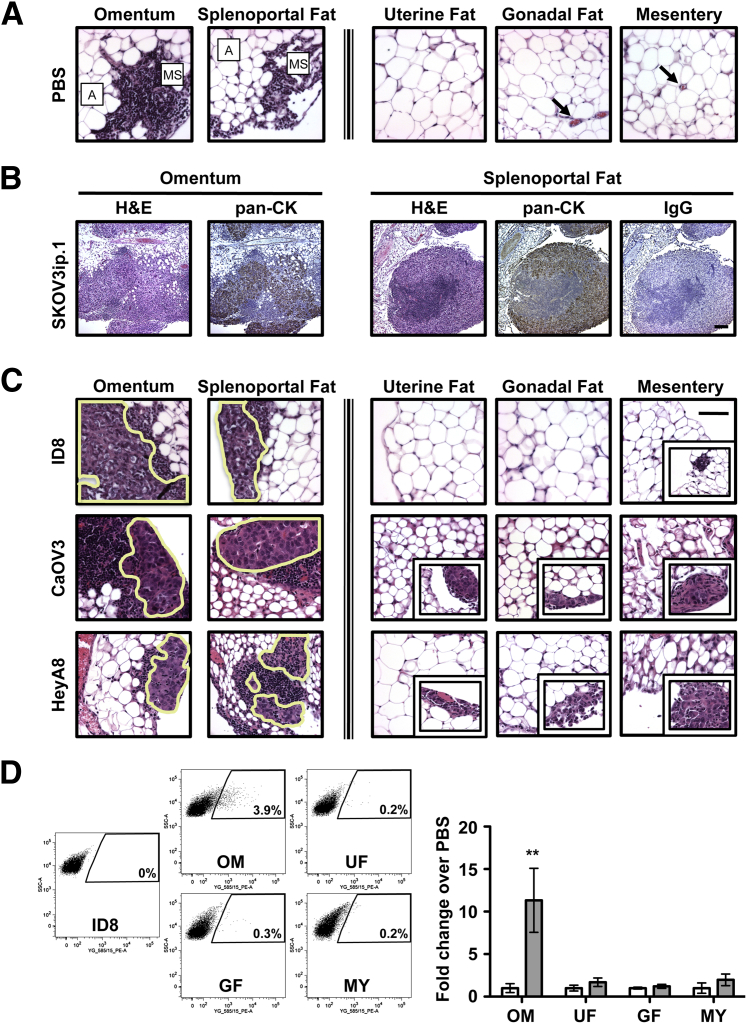
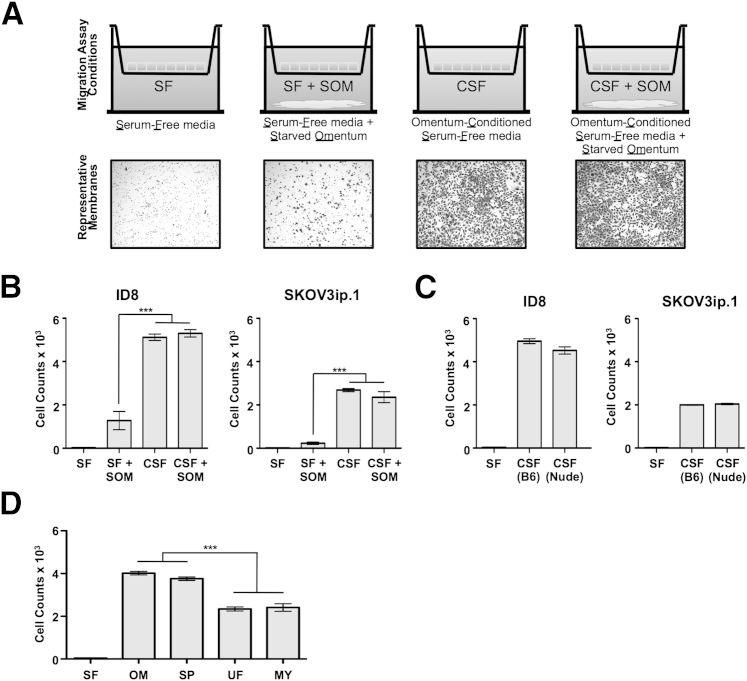
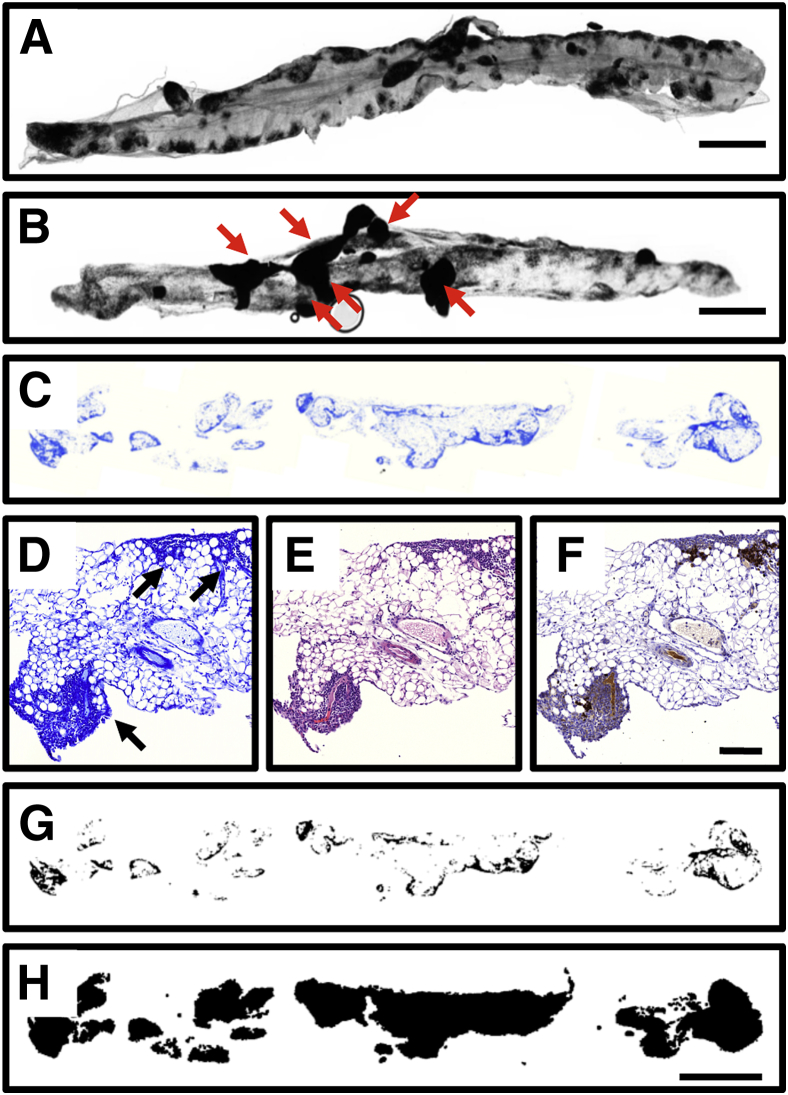
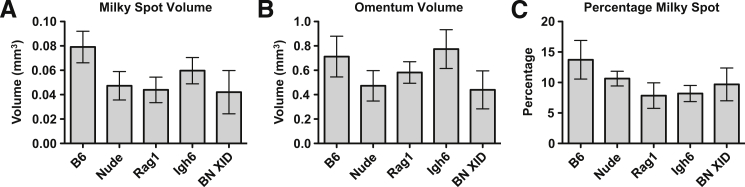
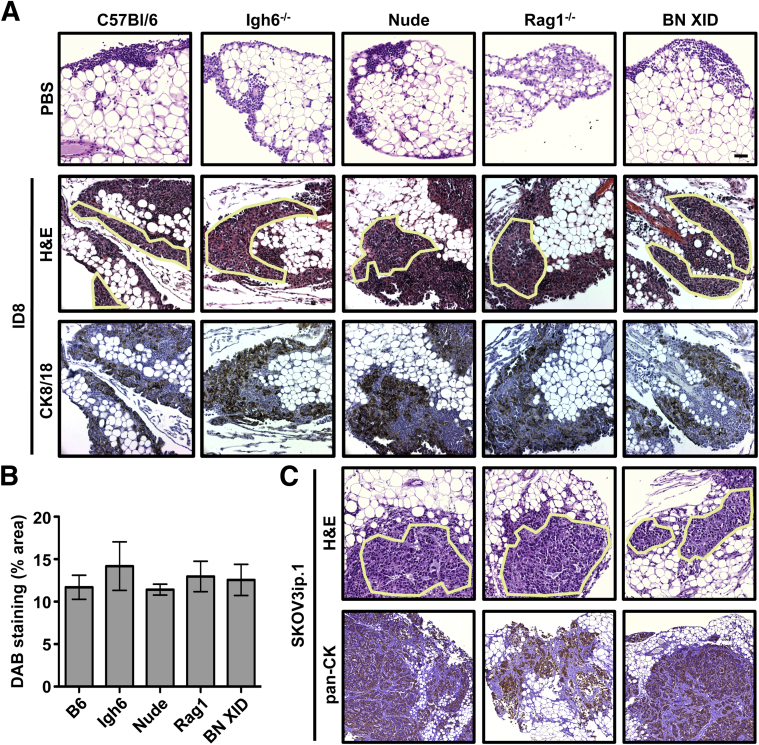
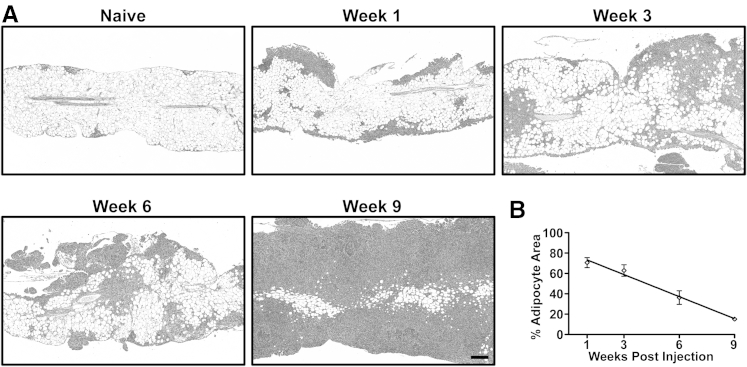
The goal of controlling ovarian cancer metastasis formation has elicited considerable interest in identifying the tissue microenvironments involved in cancer cell colonization of the omentum. Omental adipose is a site of prodigious metastasis in both ovarian cancer models and clinical disease. This tissue is unusual for its milky spots, comprised of immune cells, stromal cells, and structural elements surrounding glomerulus-like capillary beds. The present study shows the novel finding that milky spots and adipocytes play distinct and complementary roles in omental metastatic colonization. In vivo assays showed that ID8, CaOV3, HeyA8, and SKOV3ip.1 cancer cells preferentially lodge and grow within omental and splenoportal fat, which contain milky spots, rather than in peritoneal fat depots. Similarly, medium conditioned by milky spot-containing adipose tissue caused 75% more cell migration than did medium conditioned by milky spot-deficient adipose. Studies with immunodeficient mice showed that the mouse genetic background does not alter omental milky spot number and size, nor does it affect ovarian cancer colonization. Finally, consistent with the role of lipids as an energy source for cancer cell growth, in vivo time-course studies revealed an inverse relationship between metastatic burden and omental adipocyte content. Our findings support a two-step model in which both milky spots and adipose have specific roles in colonization of the omentum by ovarian cancer cells.


Figures

Figure 1
Figure 1
Relative locations of the main peritoneal adipose depots, with ovary, uterine horn, and small intestine indicated as points of reference. A: Left view of the peritoneal cavity of a B6 mouse, exposed via a ventral incision. This gross anatomical dissection shows the relative location of four of the five primary sources of peritoneal fat: the omentum (OM; outlined), located above the stomach and spleen; the gonadal fat (GF), surrounding the left ovary (ov); the uterine fat (UF), attached to the left uterine horn (uh); and the mesentery (MY), attached to the small intestine (si). B: The fifth source of peritoneal adipose is the splenoportal fat, which can be exposed by lifting the spleen with forceps (SP; outlined). C: To improve visualization, the mouse omentum here is dissected free from the pancreas. Although analogous to the human omentum in composition and tissue architecture, the mouse omentum consists of a single ribbon of fat attached to the pancreas. D: The five sources of peritoneal fat are excised, to show relative size. The mesentery is shown with attached mesenteric root. The scale is marked in centimeters.
Figure 2
Figure 2
Ovarian cancer cells preferentially colonize peritoneal adipose that contains milky spots. A: Milky spots (MS) are observed in the adipose (A) of the omentum and splenoportal fat of PBS-injected and naïve mice. In contrast, no milky spots were detected in the uterine fat, gonadal fat, or mesentery (each of which is composed mostly of adipocytes). Images are representative of PBS-injected B6 mice. Blood vessels are indicated by arrows. B: Examination of tissues by both standard histology (H&E) and IHC [pancytokeratin (pan-CK)] shows similar colonization of milky spots in both omentum and splenoportal fat (after injection of 1 × 10⁶ SKOV3ip.1 cells into Nude mice). Sections were first evaluated by H&E staining. The presence of epithelial (cancer) cells within the lesions was confirmed by IHC detection of cytokeratin using a pancytokeratin antibody. IHC using an IgG isotype antibody for pancytokeratin was used as a control for staining specificity. C: Evaluation of ID8, CaOV3, and HeyA8 ovarian cancer colonization of peritoneal fat depots at 7 dpi. Large cancer cell lesions in the milky spots of both the omentum and splenoportal fat are outlined. Representative examples of the cancer lesions occasionally seen in uterine, gonadal, and mesenteric fat are shown in the corresponding insets. D: Flow cytometric analyses of omentum, uterine fat, gonadal fat, and mesentery harvested from mice at 7 dpi of ID8-tdTomato cells. The quantified flow cytometry data are expressed as means ± SEM for fold change increase of tdTomato-positive events (grey bars) relative to PBS-injected mice (white bars). ∗∗P < 0.01 versus PBS controls. Original magnification: ×400 (A and C); ×100 (B).
Figure 3
Figure 3
Milky spot–containing adipose tissues show enhanced ability to stimulate directed migration. Transwell migration assays are used as an indicator of soluble factors that promote the directed migration of ovarian cancer cells in tissue-conditioned medium. A, top row: Migration assay setup. Cancer cells are placed in the upper chamber of the Transwell apparatus. The chemoattractant medium, with or without starved tissue, is placed in the lower chamber. A, bottom row: Representative membranes from ID8 migration assays. B: Quantitation of ID8 and SKOV3ip.1 cell migration in response to factors produced by omenta harvested from CD1 mice under the four conditions shown in panel A. C: Quantitation of ID8 and SKOV3ip.1 cell migration in response to SF medium conditioned by omentum from either B6 mice [CSF (B6)] or Nude mice [CSF (Nude)]. D: Migration assay of ID8 cells toward SF medium conditioned for 24 hours by tissue equivalents of omenta, splenoportal fat, uterine fat, and mesentery harvested from B6 mice. n = 5 for all conditions. Data are expressed as means ± SEM. ∗∗∗P < 0.001. CSF, omentum-conditioned SF medium; SOM, starved omentum.
Figure 4
Figure 4
An alternative protocol for labeling milky spots in mouse omenta. A: A rare example of a whole mount of a B6 omentum with clear milky spot labeling after carbon staining. B: A more typical case of a B6 omentum ineffectively stained, with several carbon plaques (arrows) obstructing milky spot visualization. C: As an alternative to carbon labeling, we developed a method in which naïve mouse omenta were paraffin-embedded, sectioned at 4 μm, and stained with Giemsa. Dark staining regions indicate dense areas of immune aggregates. D: Image of omental tissue section stained with Giemsa. Milky spots are indicated with arrowheads. E: Image of omental tissue section adjacent to that shown in panel D, stained with H&E. F: Image of omental tissue section adjacent to that shown in panel E, evaluated by IHC using anti-CD45 antibody to identify lymphocytes within the milky spot structure. G: Mask of the omentum section shown in panel C, processed so that milky spots are specifically converted to pure black pixels. H: Mask of the omentum section shown in panel C, processed so that the entire area of the omentum is converted to pure black pixels. Scale bars: 1.0 mm (A–C, G, and H); 100 μm (D–F).
Figure 5
Figure 5
The milky spot volume of the omentum is not affected by the immune status of the host. Giemsa-stained sections of omenta harvested from B6, Nude, Rag1, Igh6, and BN XID mice were processed, sectioned, Giemsa stained, and imaged to determine the area of milky spots and the whole omenta area on each section. A: Milky spot volume per omentum, calculated by multiplying the area of each section by 4 μm and summing the sections. B: Total volume of the whole omentum. C: Milky spot volume as a percentage of the total omentum volume. For each mouse strain, milky spot and omental volumes were determined for five independent animals. No measurements differed statistically among any of the mouse strains (one-way analysis of variance). Data are expressed as means ± SEM.
Figure 6
Figure 6
Colonization of omental milky spots by ovarian cancer cells is not dependent on the immune status of the host. To test the possibility that the immune composition of the milky spots has a quantitative effect on ovarian cancer cell colonization, mice with deficiencies in T cells, B cells, and/or NK cells were injected intraperitoneally with either PBS (control) or 1 × 10⁶ ovarian cancer cells. A: B6, Igh6, Nude, Rag1, and BN XID mice were injected with mouse ID8 cells (syngeneic to B6 background). Omenta were collected at 7 dpi and stained with H&E. Cancer cell foci are outlined. Immunohistochemistry (IHC) against mouse cytokeratin 8/18 (CK8/18) was used to confirm the epithelial origin of the cancer cell foci. B: DAB staining area was used as an indicator of cancer cell burden in omental tissues. Values were calculated as the percentage of area with strong plus medium intensity of cytokeratin 8/18 (DAB) staining, normalized to total stained area of the slide. C: Human SKOV3ip.1 cells were injected into Nude, Rag1, and BN XID mice. Omenta were collected at 7 dpi and stained with H&E. IHC against human pancytokeratin was used to confirm the epithelial origin of cancer cell lesions. Samples from five independent animals were evaluated for each condition of each test. Data are expressed as means ± SEM. Original magnification: ×200.
Figure 7
Figure 7
Adipocyte area of the omentum decreases during the time course of ovarian cancer growth. A: A representative H&E-stained section of an omentum from a naïve B6 mouse. Milky spots are seen within adipose at the tissue periphery. Images are representative of omental tissues harvested from B6 mice at 1, 3, 6, and 9 weeks after injection. B: Quantitation of adipocyte area from H&E images; the percent adipocyte area was normalized to the whole omental area. Data are expressed as means ± SEM (n = 5 independent animals per time point). A linear regression of the data points indicates a slope significantly deviant from zero (P < 0.0001; R2 = 0.8145) Original magnification: ×50.

Similar articles

Cited by

References

    1. Naora H., Montell D.J. Ovarian cancer metastasis: integrating insights from disparate model organisms. Nat Rev Cancer. 2005;5:355–366. - PubMed
    1. Cinti S. The adipose organ. In: Fantuzzi G., Mazzone T., editors. Adipose Tissue and Adipokines in Health and Disease. Humana Press; Totowa, NJ: 2007. pp. 3–19.
    1. Hagiwara A., Takahashi T., Sawai K., Taniguchi H., Shimotsuma M., Okano S., Sakakura C., Tsujimoto H., Osaki K., Sasaki S., Shirasu M. Milky spots as the implantation site for malignant cells in peritoneal dissemination in mice. Cancer Res. 1993;53:687–692. - PubMed
    1. Roby K.F., Taylor C.C., Sweetwood J.P., Cheng Y., Pace J.L., Tawfik O., Persons D.L., Smith P.G., Terranova P.F. Development of a syngeneic mouse model for events related to ovarian cancer. Carcinogenesis. 2000;21:585–591. - PubMed
    1. Lengyel E. Ovarian cancer development and metastasis. The Am J Pathol. 2010;177:1053–1064. - PMC - PubMed

Publication types