

Discovery of structural alterations in solid tumor oligodendroglioma by single molecule analysis
- PMID: 23885787
- PMCID: PMC3727977
- DOI: 10.1186/1471-2164-14-505
Discovery of structural alterations in solid tumor oligodendroglioma by single molecule analysis
Abstract
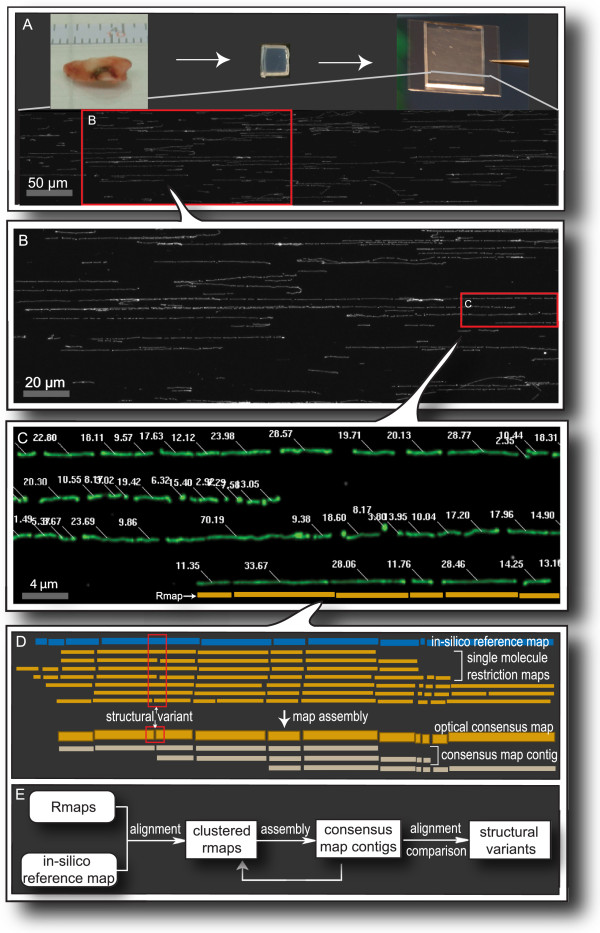
Background: Solid tumors present a panoply of genomic alterations, from single base changes to the gain or loss of entire chromosomes. Although aberrations at the two extremes of this spectrum are readily defined, comprehensive discernment of the complex and disperse mutational spectrum of cancer genomes remains a significant challenge for current genome analysis platforms. In this context, high throughput, single molecule platforms like Optical Mapping offer a unique perspective.
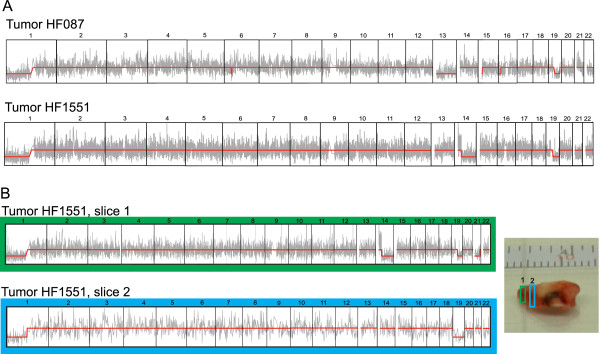
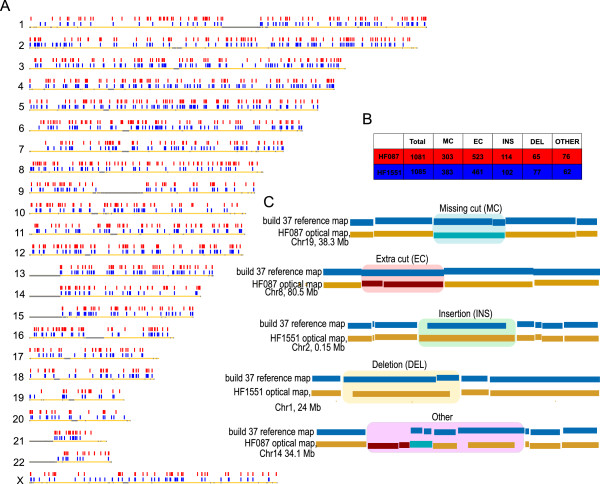
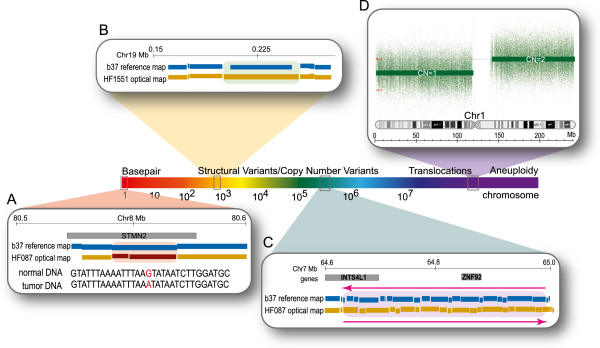
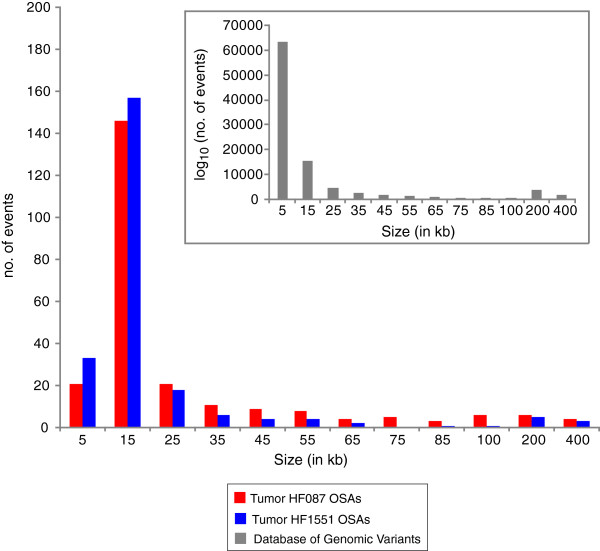
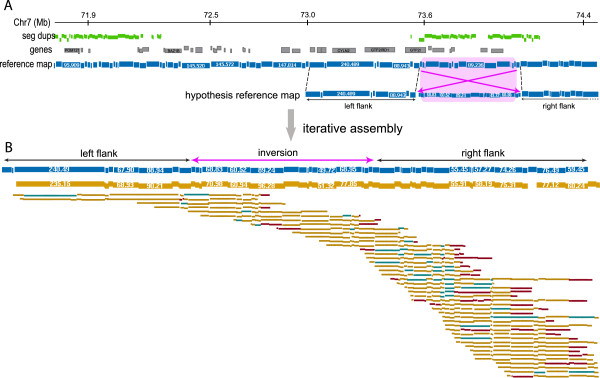
Results: Using measurements from large ensembles of individual DNA molecules, we have discovered genomic structural alterations in the solid tumor oligodendroglioma. Over a thousand structural variants were identified in each tumor sample, without any prior hypotheses, and often in genomic regions deemed intractable by other technologies. These findings were then validated by comprehensive comparisons to variants reported in external and internal databases, and by selected experimental corroborations. Alterations range in size from under 5 kb to hundreds of kilobases, and comprise insertions, deletions, inversions and compound events. Candidate mutations were scored at sub-genic resolution and unambiguously reveal structural details at aberrant loci.
Conclusions: The Optical Mapping system provides a rich description of the complex genomes of solid tumors, including sequence level aberrations, structural alterations and copy number variants that power generation of functional hypotheses for oligodendroglioma genetics.
Figures
Similar articles
-
Farewell to GBM-O: Genomic and transcriptomic profiling of glioblastoma with oligodendroglioma component reveals distinct molecular subgroups.Acta Neuropathol Commun. 2016 Jan 13;4:4. doi: 10.1186/s40478-015-0270-7. Acta Neuropathol Commun. 2016. PMID: 26757882 Free PMC article.
-
Allelic losses at 1p36 and 19q13 in gliomas: correlation with histologic classification, definition of a 150-kb minimal deleted region on 1p36, and evaluation of CAMTA1 as a candidate tumor suppressor gene.Clin Cancer Res. 2005 Feb 1;11(3):1119-28. Clin Cancer Res. 2005. PMID: 15709179
-
Chromosomal imbalances detected by array comparative genomic hybridization in human oligodendrogliomas and mixed oligoastrocytomas.Genes Chromosomes Cancer. 2005 Jan;42(1):68-77. doi: 10.1002/gcc.20108. Genes Chromosomes Cancer. 2005. PMID: 15472895
-
Molecular background of oligodendroglioma: 1p/19q, IDH, TERT, CIC and FUBP1.CNS Oncol. 2015;4(5):287-94. doi: 10.2217/cns.15.32. Epub 2015 Nov 6. CNS Oncol. 2015. PMID: 26545048 Free PMC article. Review.
-
Oligodendrogliomas: new insights from the genetics and perspectives.Curr Opin Oncol. 2012 Nov;24(6):687-93. doi: 10.1097/CCO.0b013e328357f4ea. Curr Opin Oncol. 2012. PMID: 22913971 Review.
Cited by
-
Computational methods for optical mapping.Gigascience. 2014 Dec 30;3(1):33. doi: 10.1186/2047-217X-3-33. eCollection 2014. Gigascience. 2014. PMID: 25671093 Free PMC article. Review.
-
Comparative Genomic Analyses of the Human NPHP1 Locus Reveal Complex Genomic Architecture and Its Regional Evolution in Primates.PLoS Genet. 2015 Dec 7;11(12):e1005686. doi: 10.1371/journal.pgen.1005686. eCollection 2015 Dec. PLoS Genet. 2015. PMID: 26641089 Free PMC article.
-
Electrostatic confinement and manipulation of DNA molecules for genome analysis.Proc Natl Acad Sci U S A. 2017 Dec 19;114(51):13400-13405. doi: 10.1073/pnas.1711069114. Epub 2017 Dec 4. Proc Natl Acad Sci U S A. 2017. PMID: 29203667 Free PMC article.
-
Chromosomal defects track tumor subpopulations and change in progression in oligodendroglioma.Converg Sci Phys Oncol. 2015 Sep;1(1):015001. doi: 10.1088/2057-1739/1/1/015001. Epub 2015 Jun 16. Converg Sci Phys Oncol. 2015. PMID: 31602317 Free PMC article.
-
Image processing for optical mapping.Gigascience. 2015 Nov 26;4:57. doi: 10.1186/s13742-015-0096-z. eCollection 2015. Gigascience. 2015. PMID: 26617984 Free PMC article. Review.
References
-
- Bos JL. Ras oncogenes in human cancer: a review. Cancer Res. 1989;49(17):4682–4689. - PubMed
Publication types
MeSH terms
Grants and funding
LinkOut - more resources
Full Text Sources
Other Literature Sources
