Review
. 2013;50(5):357-71.
doi: 10.1159/000353883. Epub 2013 Jul 24.

From structure to function: mitochondrial morphology, motion and shaping in vascular smooth muscle

Affiliations
Review

From structure to function: mitochondrial morphology, motion and shaping in vascular smooth muscle

John G McCarron et al. J Vasc Res. 2013.

Abstract

The diversity of mitochondrial arrangements, which arise from the organelle being static or moving, or fusing and dividing in a dynamically reshaping network, is only beginning to be appreciated. While significant progress has been made in understanding the proteins that reorganise mitochondria, the physiological significance of the various arrangements is poorly understood. The lack of understanding may occur partly because mitochondrial morphology is studied most often in cultured cells. The simple anatomy of cultured cells presents an attractive model for visualizing mitochondrial behaviour but contrasts with the complexity of native cells in which elaborate mitochondrial movements and morphologies may not occur. Mitochondrial changes may take place in native cells (in response to stress and proliferation), but over a slow time-course and the cellular function contributed is unclear. To determine the role mitochondrial arrangements play in cell function, a crucial first step is characterisation of the interactions among mitochondrial components. Three aspects of mitochondrial behaviour are described in this review: (1) morphology, (2) motion and (3) rapid shape changes. The proposed physiological roles to which various mitochondrial arrangements contribute and difficulties in interpreting some of the physiological conclusions are also outlined.


Figures

Fig. 1
Fig. 1
Mitochondrial phenotypes in native and cultured smooth muscle cells. a A cultured single vascular smooth muscle cell showing the arrangement of mitochondria. The organelle is scattered through the cytoplasm and is arranged in various orientations. Mitochondria were labelled with MitoTracker Green. b Example mitochondria showing the diverse phenotypes that include small spheres, swollen spheres, straight rods, twisted rods, branched rods and loops. c A native smooth muscle cell showing the arrangement of mitochondria. The organelle is distributed throughout the cytoplasm and appears to be largely organised parallel to the long axis of the cell. Mitochondria were labelled with MitoTracker Green. d Example mitochondria showing the relatively uniform mitochondrial phenotype (when compared to the cultured cell) of spheres and straight rods. Scale bars = 10 μm.
Fig. 2
Fig. 2
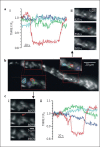
b Transient ΔΨM depolarization in individual mitochondria. The ΔΨM of individual mitochondria for approximately half of one intact smooth muscle cell. The ΔΨM was measured by membrane potential fluorophore TMRE (10 nM). The fluorescence intensity from TMRE (10 nM) is directly proportional to the ΔΨM of individual mitochondria. Two subregions (a, c) are shown on an enlarged scale and the fluorescence intensity of four individual, neighbouring mitochondria measured (regions are shown circled in four colours that correspond to the four coloured traces in graphs ai and cii). aii, ci Selected frames at the times indicated show localized regions of TMRE fluorescence fluctuation (red arrows). ai, cii Fluorescence intensity (F) of individual regions of interest of corresponding colour, normalized to initial fluorescence values (F0) show that in both cases the regions circled in red transiently lose (depolarize) then regain (repolarize) fluorescence. Thus, since the ΔΨM of mitochondria may change independently of close neighbours, the organelles are a series of individual structures [from Avlonitis et al., [29]].
Fig. 3
Fig. 3
Mitochondria are largely immobile in native and highly dynamic in cultured cerebral resistance artery smooth muscle cells. a Motion tracks of the 6 most motile mitochondria from native cells (top) are compared with the organelles' typical movement in cultured cells (bottom). The plot shows the x-y displacement and velocities of each mitochondrion. Mitochondria in native cells show almost no movement, whereas those in cultured cells engage in brief bursts of motion at speeds of ∼160 nm s-1, resulting in substantial movement of the organelle. b To provide a sense of scale of the movement the motion tracks (in red) are overlaid on the mitochondria images. The yellow circles show the position of the mitochondria's centre in the first frame of the sequence. The red motion tracks on the mitochondria of the native cells are ∼1 pixel and so difficult to visualize. c The displacement of the tracked mitochondria plotted as a function of time. Displacement is defined as the distance between the position of an organelle at time t and at time t = 0. Mitochondria in cultured cells (blue) undergo bursts of motion that cover large distances when compared to the displacement of mitochondria within the native cells (red). d The instantaneous speed of tracked mitochondria (native, red; cultured, blue) was measured by comparing the organelles position over 1-second intervals. The speeds have been separated in the vertical axis for clarity. Aside from two global motion events due to slight contraction of the entire cell (shown in grey) the mitochondria in the native cell are inactive. In the cultured cell many bursts of high-speed motion occurred with a maximum speed of typically 100 nm s-1. In all experiments TMRE was used to visualise mitochondria and the experiments were carried out at room temperature [from Chalmers et al., [26]].
Fig. 4
Fig. 4
Illustration of the general scheme adopted by the eukaryotic organelle transport network. a Tubulin dimers polymerise to form a cylindrical microtubule. One end of the molecular motor (kinesin or dynein; green) binds to sites on the microtubule along which they ‘walk’. The other side of the molecular motor attaches to specific membrane-associated proteins (e.g. miro or syntabulin; red) on the mitochondria via specialized linker proteins (milton; blue) [8]. Signalling molecules, such as Ca2+, regulate the attachment (left inset) of the motor/linker complex [7,8] to provide mitochondrial positioning control [108]. b Kinesin is vanishingly small when compared to the size of the mitochondrion. The cartoon of a mitochondrion, microtubule and kinesin motor protein is drawn approximately to scale. The microtubule is ∼24 nm in diameter and has attached the kinesin motor protein feet. The feet are separated by ∼5 nm [50]. The kinesin feet are attached to the mitochondrion via a lengthy (∼70 nm) coiled coil connecting stalk [109]. The mitochondrion drawn in the figure is 2,000 × 500 nm. Kinesin is small when compared to the mitochondrion (the inset shows an expanded view of kinesin feet). Perhaps multiple kinesin motors attach to a mitochondrion to achieve higher speeds in mitochondrial movement [51,110]. An interplay of multiple motors moving in opposing directions may create a ‘tug of war’ to regulate the organelle's direction of movement and speed [111,112].
Fig. 5
Fig. 5
Proposed routes for dynamic changes in mitochondrial morphology. By fission, fusion, growth and structural reorganisation, mitochondria continuously remodel to create a diverse range of morphologies. The diagram structures (i-x) and the associated arrows illustrate potential routes of morphological change, alongside representative live-cell images of mitochondria from cells stained with MitoTracker Green (a-g). Globular (i, a) and rod-like structures (ii-iv, a) can be transformed into both branched (v, b) and curved structures (vi-vii, c, d), whilst elongated rod-like mitochondria can fragment into multiple smaller mitochondria (viii-x, e-g). e-g Images are taken from a single image series, a movie of which is provided in the supplementary material (online suppl. video 2, ‘sausage string movie’ running at ∼40× real-time speed). The magnification is the same for all images and the yellow scale bar (a) = 5 μm.

References

    1. Hajnoczky G, Hager R, Thomas AP. Mitochondria suppress local feedback activation of inositol 1,4,5-trisphosphate receptors by Ca2+ J Biol Chem. 1999;274:14157–14162. - PubMed
    1. Narayanan D, Xi Q, Pfeffer LM, Jaggar JH. Mitochondria control functional cav1.2 expression in smooth muscle cells of cerebral arteries. Circ Res. 2010;107:631–641. - PMC - PubMed
    1. Chalmers S, Olson ML, MacMillan D, Rainbow RD, McCarron JG. Ion channels in smooth muscle: regulation by the sarcoplasmic reticulum and mitochondria. Cell Calcium. 2007;42:447–466. - PubMed
    1. Wallace DC. Mitochondrial diseases in man and mouse. Science. 1999;283:1482–1488. - PubMed
    1. Tandler B, Hoppel CL. Studies on giant mitochondria. Ann NY Acad Sci. 1986;488:65–81. - PubMed

Publication types

MeSH terms