Meta-Analysis
. 2014 Sep;9(9):1289-302.
doi: 10.1093/scan/nst106. Epub 2013 Jul 24.

Informatic parcellation of the network involved in the computation of subjective value

Affiliations
Meta-Analysis

Informatic parcellation of the network involved in the computation of subjective value

John A Clithero et al. Soc Cogn Affect Neurosci. 2014 Sep.

Abstract

Understanding how the brain computes value is a basic question in neuroscience. Although individual studies have driven this progress, meta-analyses provide an opportunity to test hypotheses that require large collections of data. We carry out a meta-analysis of a large set of functional magnetic resonance imaging studies of value computation to address several key questions. First, what is the full set of brain areas that reliably correlate with stimulus values when they need to be computed? Second, is this set of areas organized into dissociable functional networks? Third, is a distinct network of regions involved in the computation of stimulus values at decision and outcome? Finally, are different brain areas involved in the computation of stimulus values for different reward modalities? Our results demonstrate the centrality of ventromedial prefrontal cortex (VMPFC), ventral striatum and posterior cingulate cortex (PCC) in the computation of value across tasks, reward modalities and stages of the decision-making process. We also find evidence of distinct subnetworks of co-activation within VMPFC, one involving central VMPFC and dorsal PCC and another involving more anterior VMPFC, left angular gyrus and ventral PCC. Finally, we identify a posterior-to-anterior gradient of value representations corresponding to concrete-to-abstract rewards.

Keywords: IBMA; decision making; fMRI; meta-analysis; value.


Figures

Fig. 1
Fig. 1
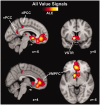
Reliable neural features of value identified using CBMA. To first identify all brain regions that reliably contain any value-related information, we used all available contrasts of subjective value (N = 104). We found distinct clusters in VMPFC, VSTR and both dorsal and ventral PCC. The VMPFC cluster also extended into subgenual cingulate as well as regions commonly labeled medial prefrontal cortex and frontal polar cortex. The global maximum ALE value (ALE = 68.89 × 10⁻³) was located in left VSTR. The scale reflects ALE values determined to survive a voxel-level significance of P < 0.001 and a cluster-corrected threshold of P < 0.05. The colorbar spans ALE values of 18.23 × 10⁻³ (min) to 68.89 × 10⁻³ (max). Coordinates and cluster information are listed in Table 3.
Fig. 2
Fig. 2
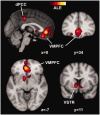
Common co-activation with VMPFC during value computation. (a) Three local maxima were identified in the large ventral PFC cluster in the ALE analysis that included all values (left, from Figure 1). The global maximum was located in central VMPFC (cVMPFC, red), and two distinct local maxima were more anterior (aVMPFC, green) and ventral (vVMPFC, blue) to the global maximum. Around each of those three coordinates, a 9 mm radius sphere was drawn (right) to identify contrasts with reported foci in the vicinity of those local maxima. (b) Several common areas in VMPFC were found to be active across all three seed regions (white). The same cluster threshold for significance in all other ALE tests was applied here. (c) Both the cVMPFC seed and the aVMPFC seed had several distinct areas of co-activation. For cVMPFC (red), this included dPCC, SFG, VSTR and lOFC. For aVMPFC (green), this included ANG) as well as vPCC.
Fig. 3
Fig. 3
Reliable neural features of value during the decision phase using CBMA. We collected all available contrasts for value signals during a decision phase (N = 69) to identify consistent positive correlations with decision value signals. The global maximum (ALE = 63.29 × 10⁻³) was found in VMPFC, and consistent activation was also found in dPCC and VSTR. Notably, the VMPFC cluster extended to other parts of the ventral and anterior parts of prefrontal cortex. The scale reflects ALE values determined to survive a voxel-level significance of P < 0.001 and a cluster-corrected threshold of P < 0.05. The colorbar spans ALE values of 15.70 × 10⁻³ (min) to 63.29 × 10⁻³ (max). Coordinates and cluster information are listed in Table 5.
Fig. 4
Fig. 4
Reliable neural features of value during the decision phase using IBMA. We used data from previously published studies (N = 21 contrasts). We performed a mixed-effects analysis to identify consistently positive correlation with measures of stimulus or decision value. The IBMA identified distinct clusters in VMPFC, dPCC and vPCC as well as SFG. The VMPFC cluster extended into the ventral part of the striatum (VSTR). The global maximum (z = 6.88) was located in VMPFC. The scale reflects mixed-effects z-scores determined to survive a voxel-level significance of P < 0.001 and a cluster-corrected threshold of P < 0.05. The colorbar spans z-values of 3.10 (min) to 6.88 (max). Coordinates and cluster information are listed in Table 6.
Fig. 5
Fig. 5
Reliable neural features of value during the outcome phase using CBMA. Using all available outcome value contrasts (N = 32), we identified several significant clusters of consistent outcome value across studies in VMPFC and VSTR. The global maximum (ALE = 21.98 × 10⁻³) was located in left VSTR. The scale reflects ALE values determined to survive a voxel-level significance of P < 0.001 and a cluster-corrected threshold of P < 0.05. The colorbar spans ALE values of 10.54 × 10⁻³ (min) to 21.98 × 10⁻³ (max). Coordinates and cluster information are listed in Table 7.
Fig. 6
Fig. 6
Comparison of decision and outcome value signals using CBMA. To determine if different brain regions are differentially recruited during the decision and outcome phase, we contrasted ALE images for the decision and outcome phase. (a) The decision > outcome comparison identified significant differences in both dPCC and VMPFC near subgenual cingulate. (b) The outcome > decision contrast identified a more anterior area of MPFC, as well as subcallosal cortex. (c) A conjunction of the two value computations, using the ALE maps presented in Figures 3 and 5, revealed common activation in VSTR and another portion of VMPFC. Coordinates and cluster information for the contrasts are listed in Table 8.
Fig. 7
Fig. 7
Comparison of value in different reward modalities using CBMA. (a) Using all value contrasts involving money as a reward modality (N = 50), we found significant ALE values in VMPFC, VSTR and dPCC. The colorbar spans ALE values of 13.95 × 10⁻³ (min) to 43.57 × 10⁻³ (max). (b) We performed the same analysis for studies using food as rewards (N = 24). This analysis revealed only two significant clusters, in a more ventral and posterior portion of VMPFC. The colorbar spans ALE values of 9.81 × 10⁻³ (min) to 26.21 × 10⁻³ (max). (c) Using ‘other’ to collect all other value contrasts using a single reward modality (N = 24), we again found reliable VMPFC and VSTR activity. The colorbar spans ALE values of 9.70 × 10⁻³ (min) to 32.88 × 10⁻³ (max). (d) Here, on the right, the cluster maxima coordinates are surrounded by 5 mm radius spheres for display. We see that most ventral maximum belongs to studies of food. Although one of the money local maxima (green) overlaps with the other category (blue), we note that the only reward modality with the most anterior cluster was money. This represents a posterior-to-anterior representation of reward modalities. The scales in (a)–(c) reflect ALE values determined to survive a voxel-level significance of P < 0.001 and a cluster-corrected threshold of P < 0.05. Coordinates and cluster information are listed in Table 9.
Fig. 8
Fig. 8
Decision and outcome values of food studies using CBMA. The ALE analyses here reflect a post hoc test of the studies involving only food (N = 24), with decision value (red) and outcome value (blue) calculated separately. As would be expected, overlap occurs in the same posterior VMPFC area highlighted in Figure 7. All voxels shown survive voxel-level significance of P < 0.001.

References

    1. Anderson AK, Christoff K, Stappen I, et al. Dissociated neural representations of intensity and valence in human olfaction. Nature Neuroscience. 2003;6:196–202. - PubMed
    1. Andrews-Hanna JR, Reidler JS, Sepulcre J, Poulin R, Buckner RL. Functional-anatomic fractionation of the brain’s default network. Neuron. 2010;65:550–62. - PMC - PubMed
    1. Basten U, Biele G, Heekeren HR, Fiebach CJ. How the brain integrates costs and benefits during decision making. Proceedings of the National Academy of Sciences, USA. 2010;107:21767–72. - PMC - PubMed
    1. Baumgartner T, Knoch D, Hotz P, Eisenegger C, Fehr E. Dorsolateral and ventromedial prefrontal cortex orchestrate normative choice. Nature Neuroscience. 2011;14:1468–74. - PubMed
    1. Beckmann M, Johansen-Berg H, Rushworth MF. Connectivity-based parcellation of human cingulate cortex and its relation to functional specialization. Journal of Neuroscience. 2009;29:1175–90. - PMC - PubMed

Publication types