. 2013 Nov;15(11):1518-31.
doi: 10.1093/neuonc/not099. Epub 2013 Jul 25.

Na⁺/K⁺-ATPase β2-subunit (AMOG) expression abrogates invasion of glioblastoma-derived brain tumor-initiating cells

Affiliations

Na⁺/K⁺-ATPase β2-subunit (AMOG) expression abrogates invasion of glioblastoma-derived brain tumor-initiating cells

Matthew Z Sun et al. Neuro Oncol. 2013 Nov.

Abstract

Background: Mechanisms of glioma invasion remain to be fully elucidated. Glioma cells within glioblastoma multiforme (GBM) range from well-differentiated tumor cells to less-differentiated brain tumor-initiating cells (BTICs). The β2-subunit of Na(+)/K(+)-ATPase, called the adhesion molecule on glia (AMOG), is highly expressed in normal glia but is thought to be universally downregulated in GBM. To test our hypothesis that expression of AMOG is heterogeneous in GBM and confers a less invasive phenotype, we compared it between BTICs and differentiated cells from patient-matched GBM and then tested GBM invasion in vitro after AMOG overexpression.

Methods: Immunohistochemistry, immunoblotting, and real-time PCR were used to characterize AMOG protein and mRNA expression in tumor samples, BTICs, and differentiated cells. Matrigel invasion assay, scratch assay, and direct cell counting were used for testing in vitro invasion, migration, and proliferation, respectively.

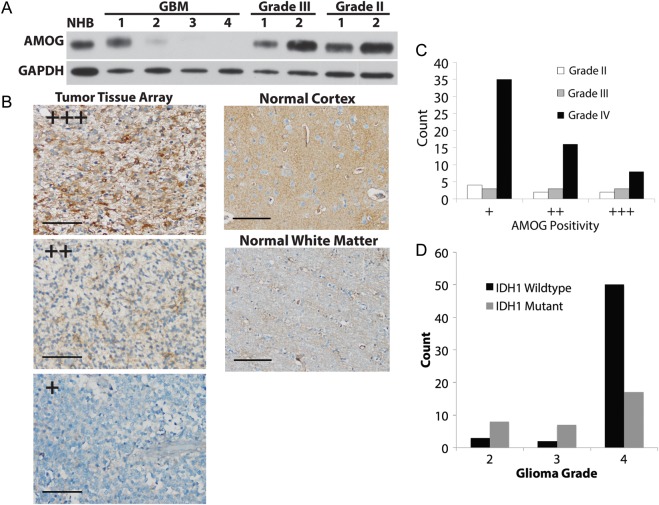
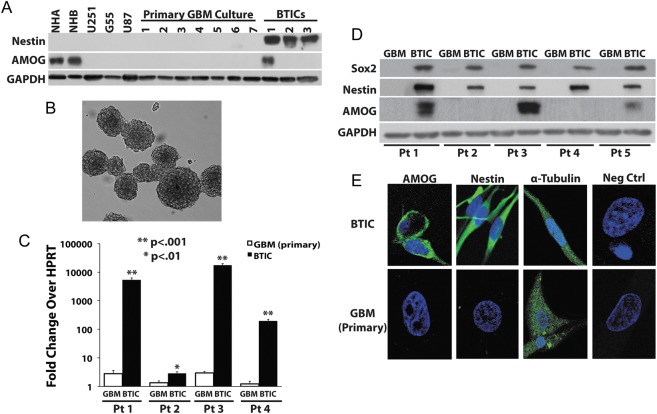
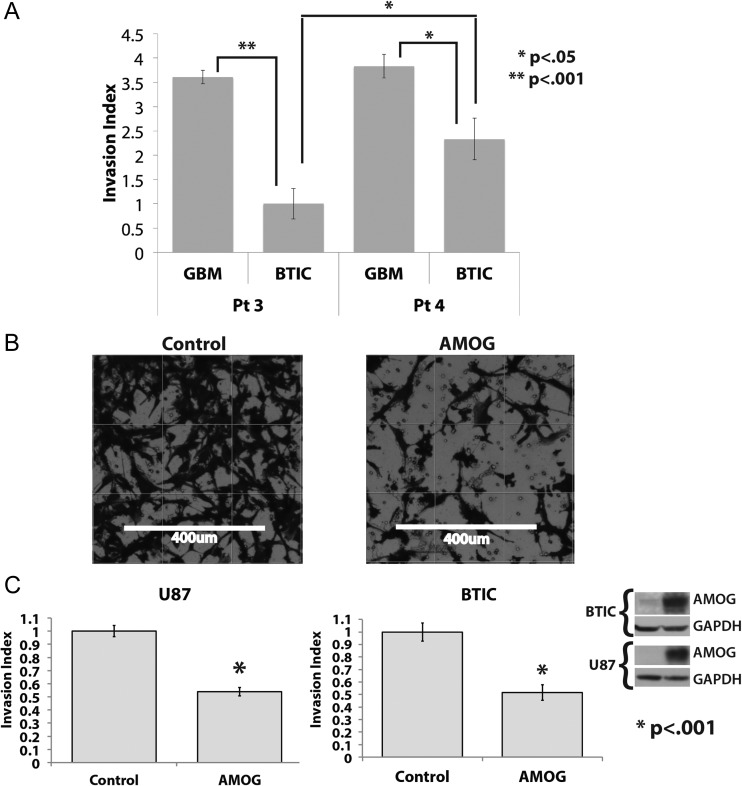
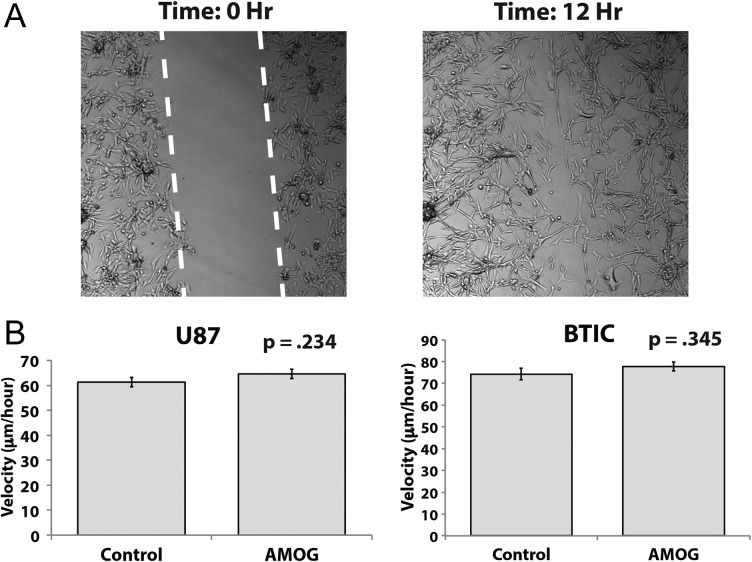
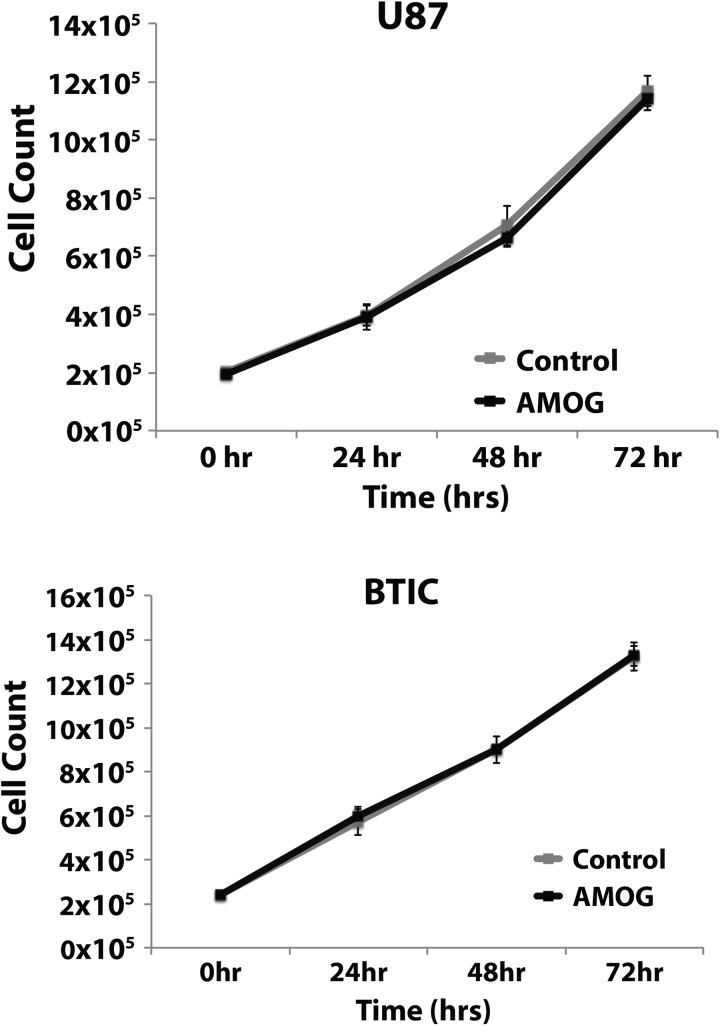
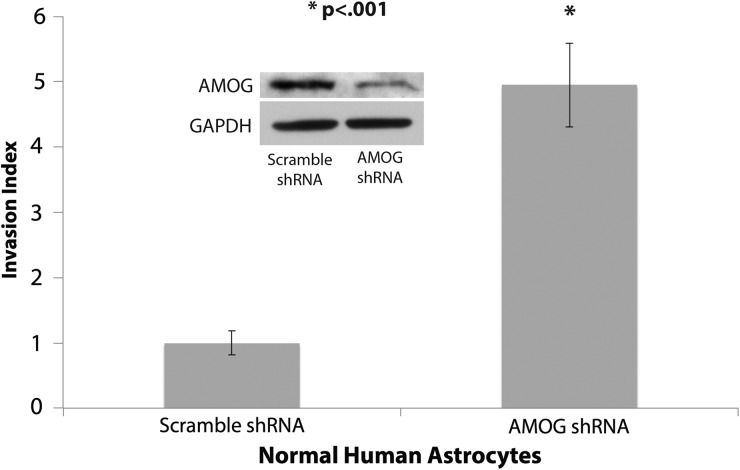
Results: While AMOG expression is heterogeneous in astrocytomas of grades II-IV, it is lost in most GBM. BTICs express higher levels of AMOG mRNA and protein compared with patient-matched differentiated tumor cells. Overexpression of AMOG decreased GBM cell and BTIC invasion without affecting migration or proliferation. Knockdown of AMOG expression in normal human astrocytes increased invasion.

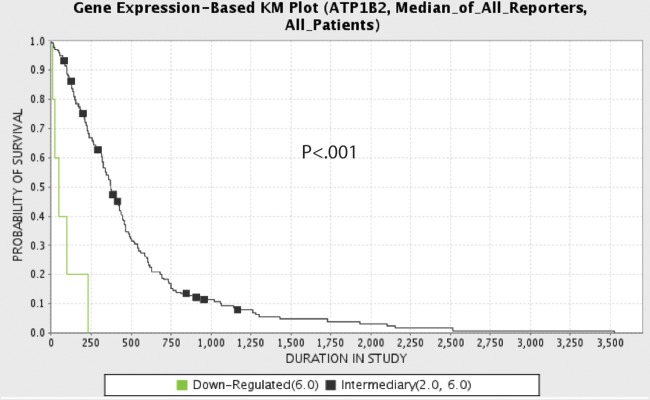
Conclusions: AMOG expression inhibits GBM invasion. Its downregulation increases invasion in glial cells and may also represent an important step in BTIC differentiation. These data provide compelling evidence implicating the role of AMOG in glioma invasion and provide impetus for further investigation.

Keywords: AMOG; Na+/K+-ATPase β2-subunit; brain tumor-initiating cells; glioblastoma; invasion.


Figures

Fig. 1.
Fig. 1.
AMOG expression is variably downregulated in gliomas. (A) Immunoblotting evaluation of AMOG expression in 4 GBM samples, 2 WHO grade III anaplastic astrocytomas, 2 WHO grade II gliomas, and normal human brain cortex (NHB). Glyceraldehyde 3-phosphate dehydrogenase (GAPDH) was used as a loading control. (B) Immunohistochemical evaluation of AMOG expression in different grades of gliomas (astrocytomas) in tissue arrays containing 59 GBM samples, 9 grade III anaplastic astrocytomas, and 8 grade II astrocytomas. NHB was used as a positive control, and white matter was used as a negative control (shown in right column). AMOG positivity is defined by categorizing the percentage of tumor cells that stain positive for AMOG into 3 categories (representative pictures in the left column): + for 0%–25%, ++ for 26%–75%, and +++ for 76%–100%. Scale bar: 100 μm. (C) Quantification of AMOG positivity in glioma tissue array samples in part B. The bars represent the number of tumor samples that fall into each staining category for each tumor grade. (D) Quantification of IDH1 wild types and mutants in the glioma tissue array. As expected, more IDH1 mutants were found in grades II and III, while more IDH1 wild types were in grade IV.
Fig. 2.
Fig. 2.
BTICs overexpress AMOG compared with differentiated glioma cells. (A) Protein expressions of AMOG in normal human brain cortex (NHB), normal human astrocytes (NHA), 3 established GBM cell lines (U251, G55, U87), 7 primary differentiated GBM cultures, and 3 BTIC cultures were assessed by immunoblotting. Nestin expression was assessed to confirm the stemness of BTIC culture. Glyceraldehyde 3-phosphate dehydrogenase (GAPDH) was used as a loading control. (B) GBM stem cells cultured in monolayer are capable of forming neurospheres in the absence of laminin substrate. (C) AMOG mRNA expression was quantified in 4 pairs of patient-matched BTIC and differentiated GBM cultures. AMOG mRNA levels are normalized and are expressed as fold increase over HPRT mRNA levels for each sample. The comparisons are made within each pair of cultures. (*P < .01; **P < .001). (D) AMOG protein expression was assessed by immunoblotting for 5 pairs of patient-matched BTIC and non-BTIC cultures (inclusive of the 4 pairs in Fig. 2C: patients 1–4). Nestin and Sox2 expressions were assessed to confirm the stemness of BTIC culture. GAPDH was used as a loading control. (E) Representative immunocytochemical staining of AMOG and nestin staining of patient-matched BTIC and differentiated primary GBM cultures. Positive control: α-tubulin; negative control: nonspecific IgG.
Fig. 3.
Fig. 3.
Overexpression of AMOG decreases GBM invasion. (A) The invasion of patient-matched BTIC and differentiated cells from patients 3 and 4 was assessed by seeding the same number of cells onto the Matrigel insert and allowing them to migrate toward 10% FBS in the bottom well. The bar graphs show each cell line's invasion index, which is calculated by normalizing the number of cells that invaded through the Matrigel in each cell line to that of the least invasive cell line. The least invasive cell line has an invasion index of 1 (*P < .05, **P < .001). (B) GBM cells were transfected with either a control vector or an AMOG overexpression vector; after 48 h, equal numbers of cells from both conditions were seeded onto the Matrigel insert and allowed to migrate toward the bottom well containing 10% FBS in media. Shown are representative pictures of control cells and AMOG-overexpressing cells from the same cell line. (C) The invasion index of the control and AMOG-overexpressing cells from the U87 cell line and a low AMOG-expressing BTIC culture. The invasion index was normalized to each cell line's control so that the baseline invasion of each cell line has an invasion index of 1 (*P < .001). GAPDH, glyceraldehyde 3-phosphate dehydrogenase. Insert: The overexpression of AMOG was confirmed by immunoblotting.
Fig. 4.
Fig. 4.
Overexpression of AMOG does not affect GBM cell migration. (A) GBM cells were allowed to migrate across a scratched gap of fixed width and imaged every 12 min while in incubation. The distance traveled and time required for the cells to close the gap were calculated. (B) Based on distance traveled and time required to close the gap, the velocity was calculated and compared between control and AMOG-overexpressing cells in the U87 cell line and a low AMOG-expressing BTIC culture.
Fig. 5.
Fig. 5.
Overexpression of AMOG does not affect GBM cell proliferation. Equal numbers of GBM cells were seeded 48 h after transfection with either a control vector or an AMOG overexpression vector, and cell numbers were determined every 24 h for 72 h by direct counting on a hemocytometer. Both U87 cells and BTIC cultures were used.
Fig. 6.
Fig. 6.
AMOG knockdown increases invasion in normal human astrocytes. Normal human astrocytes with stable AMOG knockdown using lentiviral shRNA particles exhibited significantly increased invasion. AMOG knockdown was confirmed by immunoblotting, shown in insert (*P < .001). GAPDH, glyceraldehyde 3-phosphate dehydrogenase.
Fig. 7.
Fig. 7.
Downregulation of AMOG correlates with worse clinical outcome. Kaplan–Meier (KM) analysis comparing overall survival between patients whose GBM had intermediate (black) AMOG expression (from 2-fold upregulated to 6-fold downregulated) and patients whose GBM had downregulated (green) AMOG expression (6-fold or more downregulated) (P < .001). Expression data represent mRNA microarray expression data from TCGA database queried in February 2012.

Similar articles

Cited by

References

    1. Alves TR, Lima FR, Kahn SA, et al. Glioblastoma cells: a heterogeneous and fatal tumor interacting with the parenchyma. Life Sci. 2011;89(15–16):532–539. - PubMed
    1. Parsa AT, Wachhorst S, Lamborn KR, et al. Prognostic significance of intracranial dissemination of glioblastoma multiforme in adults. J Neurosurg. 2005;102(4):622–628. - PubMed
    1. Venere M, Fine HA, Dirks PB, Rich JN. Cancer stem cells in gliomas: identifying and understanding the apex cell in cancer’s hierarchy. Glia. 2011;59(8):1148–1154. - PMC - PubMed
    1. Singh SK, Hawkins C, Clarke ID, et al. Identification of human brain tumour initiating cells. Nature. 2004;432(7015):396–401. - PubMed
    1. Messam CA, Hou J, Major EO. Coexpression of nestin in neural and glial cells in the developing human CNS defined by a human-specific anti-nestin antibody. Exp Neurol. 2000;161(2):585–596. - PubMed

Publication types

Substances