. 2013 Jul 23:4:138.
doi: 10.3389/fgene.2013.00138. eCollection 2013.

Evaluation of genetic risk score models in the presence of interaction and linkage disequilibrium

Affiliations

Evaluation of genetic risk score models in the presence of interaction and linkage disequilibrium

Ronglin Che et al. Front Genet. .

Abstract

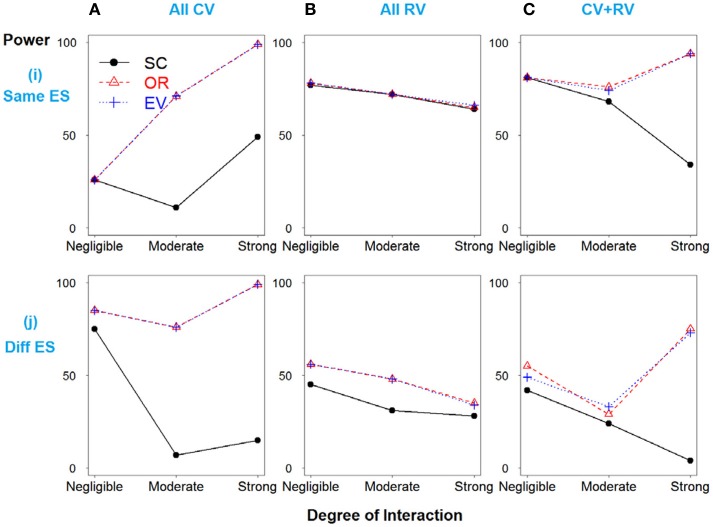
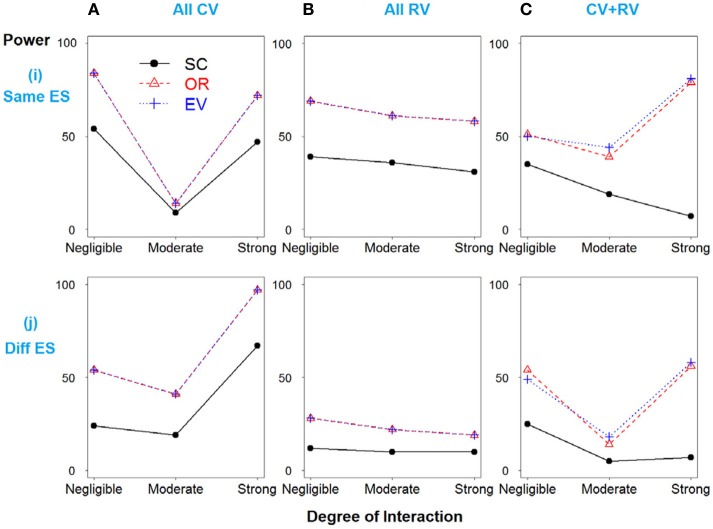
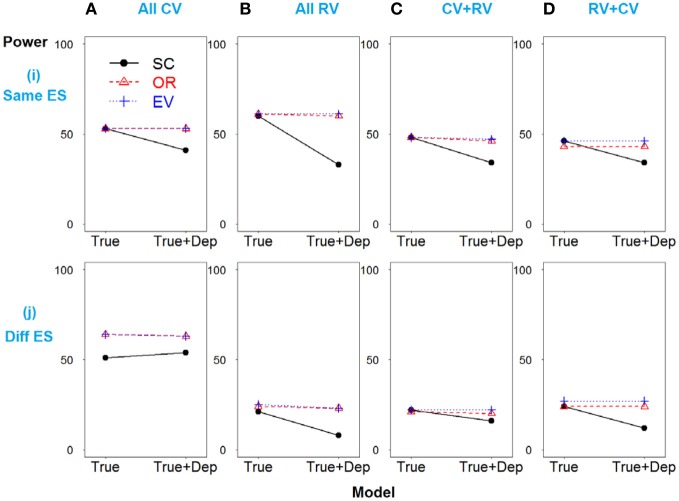
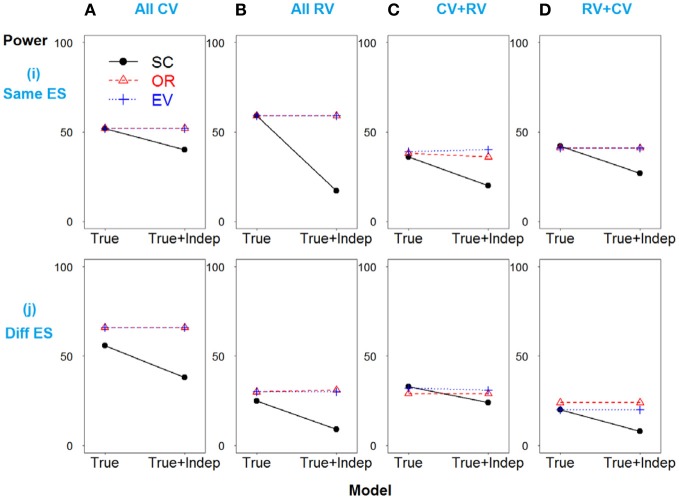
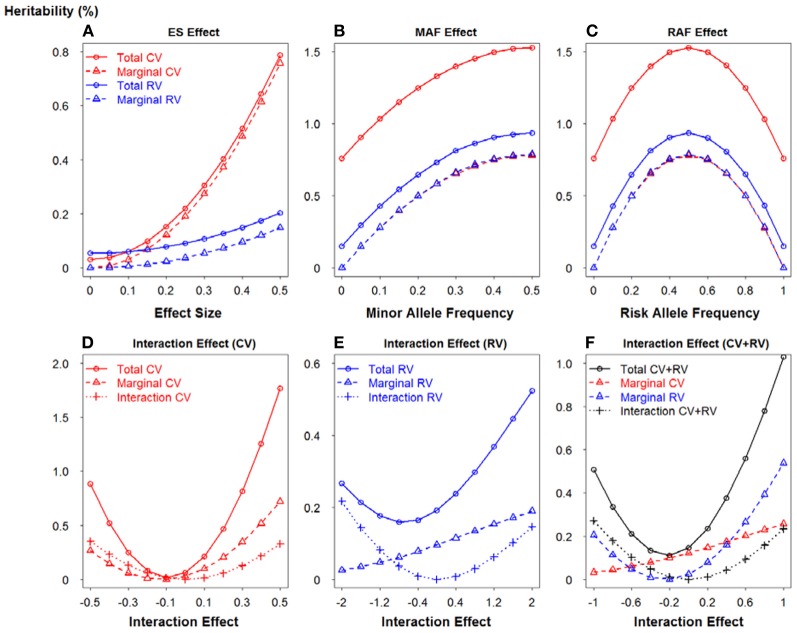
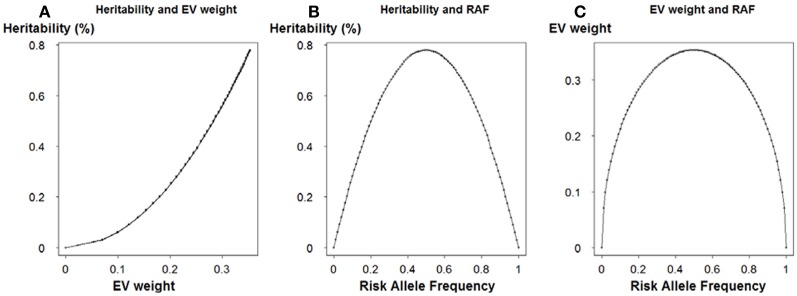
In the area of genetic epidemiology, genetic risk predictive modeling is becoming an important area of translational success. As an increasing number of genetic variants are successfully discovered, the use of multiple genetic variants in constructing a genetic risk score (GRS) for modeling has been widely applied using a variety of approaches. Previously, we compared the performance of a simple, additive GRS with weighted GRS approaches, but our initial simulation experiment assumed very simple models without many of the complications found in real genetic studies. In particular, interactions between variants and linkage disequilibrium (LD) (indirect mapping) remain important and challenging problems for GRS modeling. In the present study, we applied two simulation strategies to mimic various types of epistasis to evaluate their impact on the performance of the GRS models. We simulated a range of models demonstrating statistical interaction and linkage disequilibrium. Three genetic risk models were compared in terms of power, type I error, C-statistic and AIC, including a simple count GRS (SC-GRS), an odds ratio weighted GRS (OR-GRS) and an explained variance weighted GRS (EV-GRS). Simulation factors of interest included allele frequencies, effect sizes, strengths of interaction, degrees of LD and heritability. We extensively examined the extent to how these interactions could influence the performance of genetic risk models. Our results show that the weighted methods outperform simple count method in general even if interaction or LD is present, with well controlled type I error.

Keywords: explained variance; genetic risk score (GRS); interaction; linkage disequilibrium (LD); predictive modeling.


Figures

Figure 1
Figure 1
Power comparison for the interaction model with four deleterious SNPs. Panels by column: (A) All SNPs are common variants. (B) All SNPs are rare variants. (C) SNPs 1 and 3 are common variants, and SNPs 2 and 4 are rare variants. Panels by row: (i) SNPs have same effect size. (j) SNPs have different effect size.
Figure 2
Figure 2
Power comparison for the interaction model with two deleterious SNPs. Panels by column: (A) All SNPs are common variants. (B) All SNPs are rare variants. (C) SNPs 1 and 3 are common variants, and SNPs 2 and 4 are rare variants. Panels by row: (i) SNPs have same effect size. (j) SNPs have different effect size.
Figure 3
Figure 3
Power comparison for the strong linkage disequilibrium model when SNPs 2 and 3 are dependent. Panels by column: (A) SNPs 1 and 2 are common variants. (B) SNPs 1 and 2 are rare variants. (C) SNP 1 is common variant, and SNP 2 is rare variant. (D) SNP 1 is rare variant, and SNP 2 is common variant. Panels by row: (i) SNPs have same effect size. (j) SNPs have different effect size. “Dep” means SNPs 2 and 3 are dependent.
Figure 4
Figure 4
Power comparison for the weak linkage disequilibrium model when SNPs 2 and 3 are independent. Panels by column: (A) SNPs 1 and 2 are common variants. (B) SNPs 1 and 2 are rare variants. (C) SNP 1 is common variant, and SNP 2 is rare variant. (D) SNP 1 is rare variant, and SNP 2 is common variant. Panels by row: (i) SNPs have same effect size. (j) SNPs have different effect size. “Indep” means SNPs 2 and 3 are independent.
Figure 5
Figure 5
Relationship between effect size, minor allele frequency, risk allele frequency, interaction effect and heritability. (A) Relationship between heritability and effect size. (B) Relationship between heritability and minor allele frequency. (C) Relationship between heritability and risk allele frequency. (D) Relationship between heritability and interaction effect when SNPs are common variants. (E) Relationship between heritability and interaction effect when SNPs are rare variants. (F) Relationship between heritability and interaction effect when SNPs are common and rare variants.
Figure 6
Figure 6
Relationship between risk allele frequency, explained variance weight and heritability. (A) Relationship between heritability and explained variance weight. (B) Relationship between heritability and risk allele frequency. (C) Relationship between explained variance weight and risk allele frequency.

References

    1. Carayol J., Tores F., Konig I. R., Hager J., Ziegler A. (2010). Evaluating diagnostic accuracy of genetic profiles in affected offspring families. Stat. Med. 29, 2359–2368 10.1002/sim.4006 - DOI - PMC - PubMed
    1. Che R., Motsinger-Reif A. A. (2012). A new explained-variance based genetic risk score for predictive modeling of disease risk. Stat. Appl. Genet. Mol. Biol. 11:15 10.1515/1544-6115.1796 - DOI - PMC - PubMed
    1. Che R., Motsinger-Reif A. A., Brown C. C. (2012). Loss of power in two-stage residual-outcome regression analysis in genetic association studies. Genet. Epidemiol. 36, 890–894 10.1002/gepi.21671 - DOI - PMC - PubMed
    1. Cordell H. J. (2002). Epistasis: what it means, what it doesn't mean, and statistical methods to detect it in humans. Hum. Mol. Genet. 11, 2463–2468 10.1093/hmg/11.20.2463 - DOI - PubMed
    1. Cordell H. J. (2009). Detecting gene-gene interactions that underlie human diseases. Nat. Rev. Genet. 10, 392–404 10.1038/nrg2579 - DOI - PMC - PubMed