

doi: 10.1111/j.1468-0335.2011.00878.x.
Housing Mobility and Downsizing at Older Ages in Britain and the United States
Affiliations
- PMID: 23888295
- PMCID: PMC3719412
- DOI: 10.1111/j.1468-0335.2011.00878.x
Item in Clipboard
Housing Mobility and Downsizing at Older Ages in Britain and the United States
Economica.
.
Abstract
This paper examines geographic mobility and housing downsizing at older ages in Britain and America. Americans downsize housing much more than the British largely because Americans are much more mobile. The principal reasons for greater mobility among older Americans are two fold: (1) greater spatial distribution of geographic distribution of amenities (such as warm weather) and housing costs and (2) greater institutional rigidities in subsidized British rental housing providing stronger incentives for British renters not to move. This relatively flat British housing consumption with age may have significant implications for the form and amount of consumption smoothing at older ages.
Figures
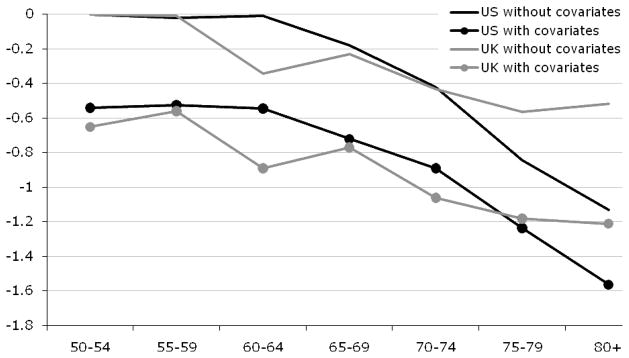
Note: Figure 1 depicts change in number of rooms across age groups normalized to zero change in age band 50–54. These changes are provided based on a model that only includes age dummies for each age band, and a model that also includes measures of changes in family composition for spouse and children living at home and changes in employment status. These models are estimated using PSID and BHPS data (see Banks et al. (2010) for further details).
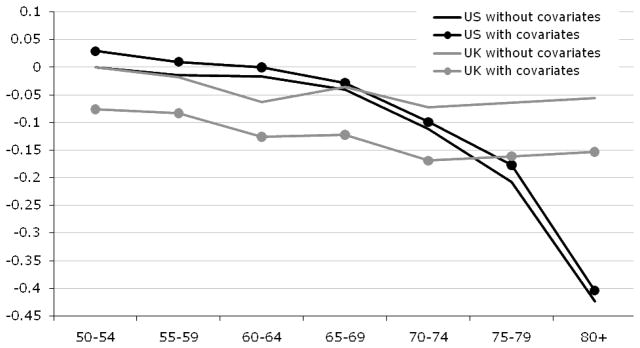
Note: See notes to Figure 1.
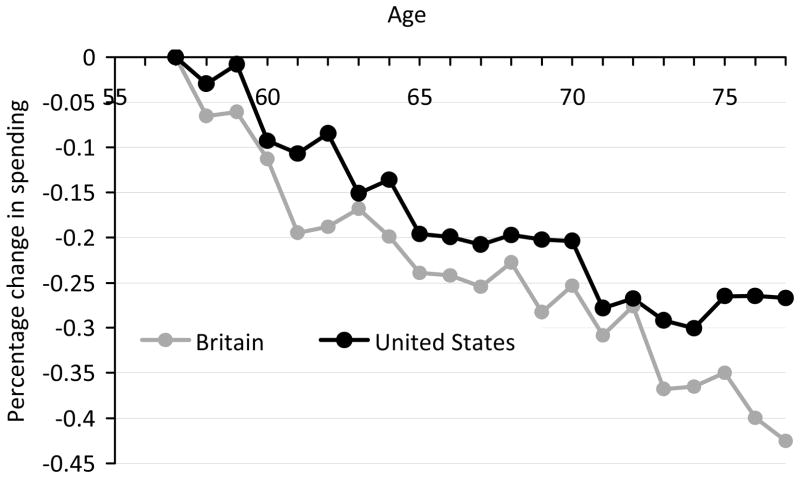
Notes: Figure 3 shows the percentage change in spending on non-housing items of expenditure by age, normalized at age 58. Data for Britain is based on data from the Expenditure and Food Survey and its predecessor the Family Expenditure Survey and data for the US is based on the Consumer Expenditure Survey. Data from both countries covers the period from 1987 to 2007.
References
-
- BANKS J, BLUNDELL R, SMITH JP. Financial wealth inequality in the United States and Great Britain. Journal of Human Resources. 2003;38:241–79.
-
- BANKS J, BLUNDELL R, OLDFIELD Z, SMITH JP. Housing price volatility and downsizing in later life. In: Wise DA, editor. Research Findings in the Economics of Aging. Chicago: University of Chicago Press; 2010. pp. 337–86.
-
- BECKETTI S, GOULD W, LILLARD L, WELCH F. The Panel Study of Income Dynamics after fourteen years: An evaluation. Journal of Labor Economics. 1988;6:472–92.
-
- DIAMOND P. Income taxation with fixed hours or work. Journal of Public Economics. 1980;13:101–10.
-
- DISNEY R, HENLEY A, STEARS G. Housing costs, house price shocks and savings behaviour among older households in Britain. Regional Science and Urban Economics. 2002;32:607–25.
Grants and funding
LinkOut - more resources
Full Text Sources