. 2013 Jul 24;79(2):335-46.
doi: 10.1016/j.neuron.2013.05.016.

Obligatory role for the immediate early gene NARP in critical period plasticity

Affiliations

Obligatory role for the immediate early gene NARP in critical period plasticity

Yu Gu et al. Neuron. .

Abstract

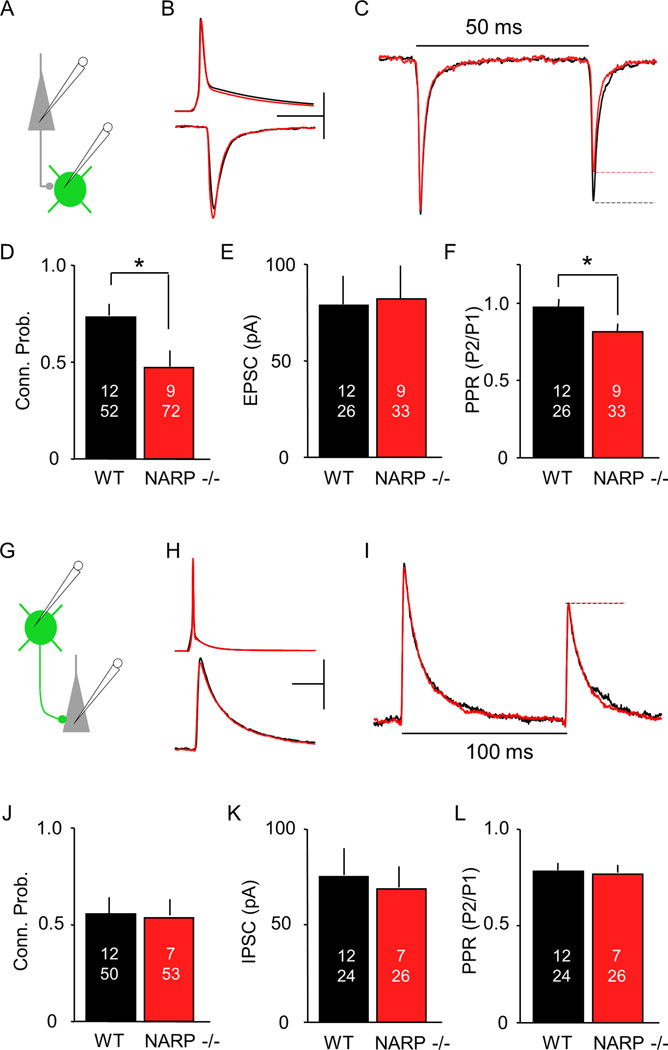
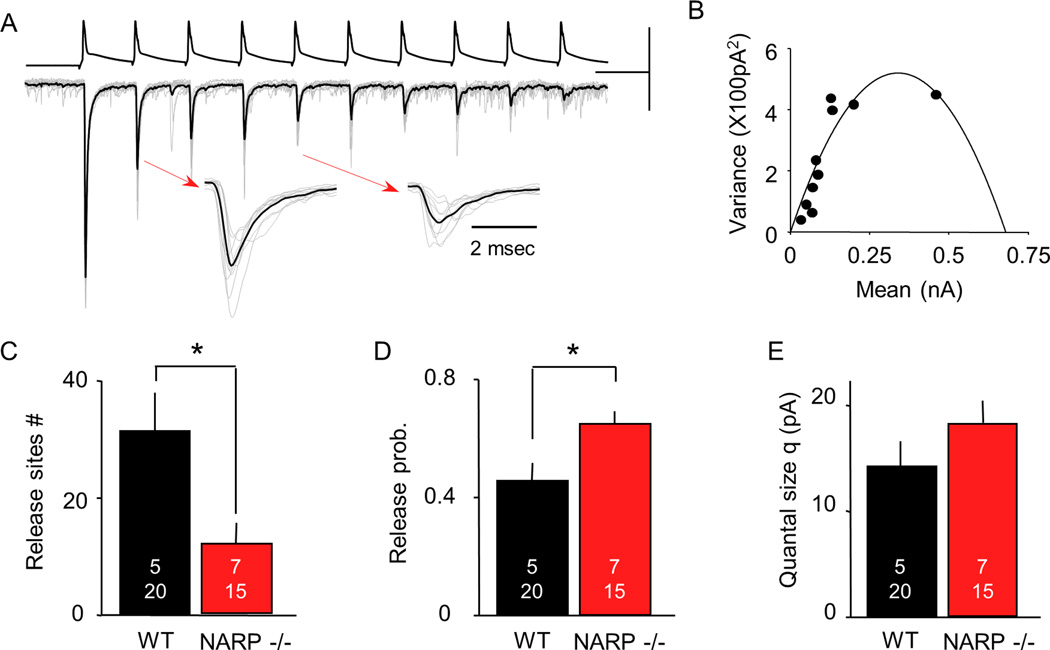
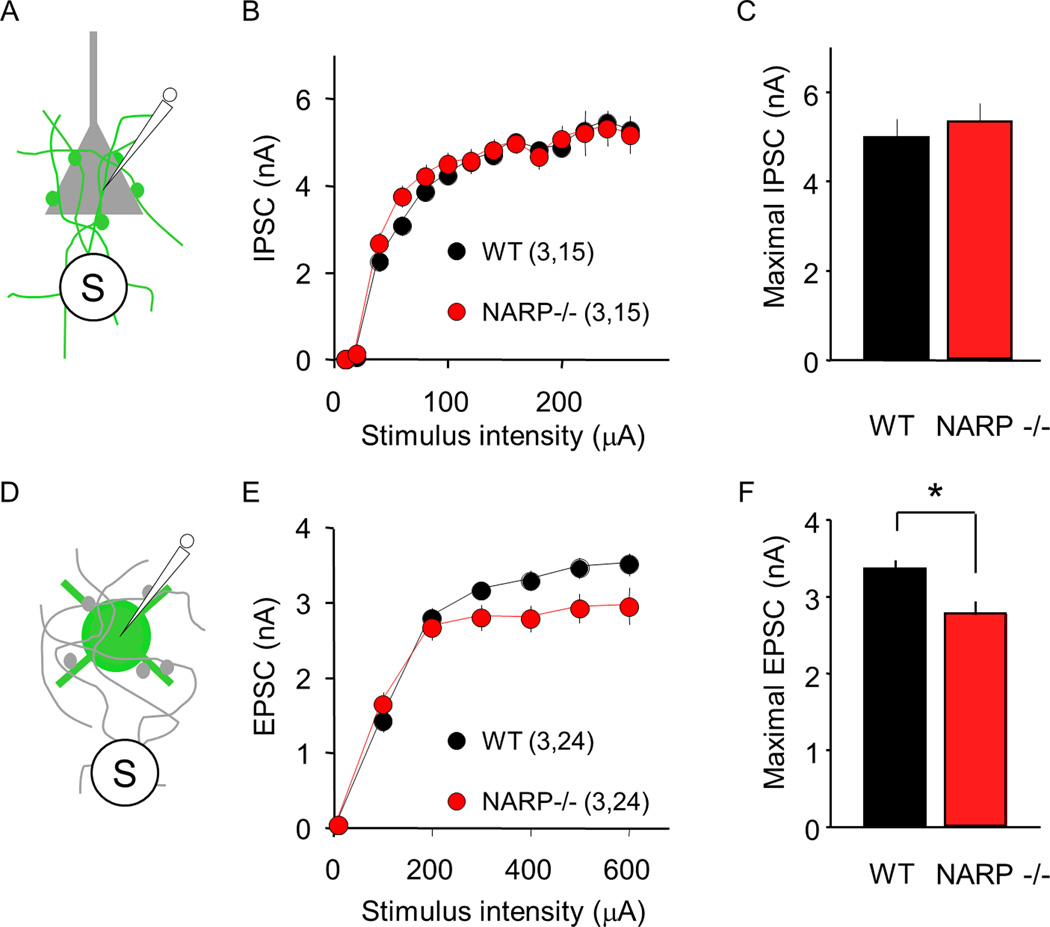
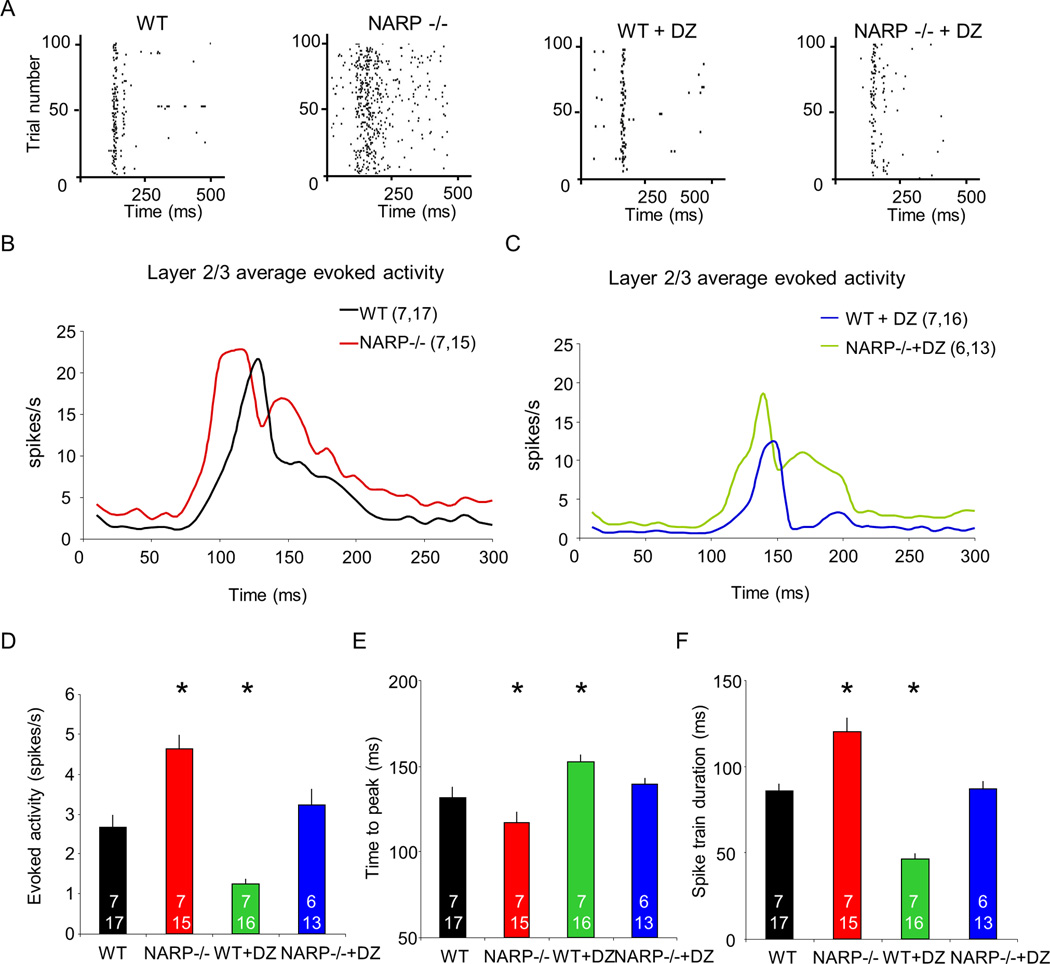
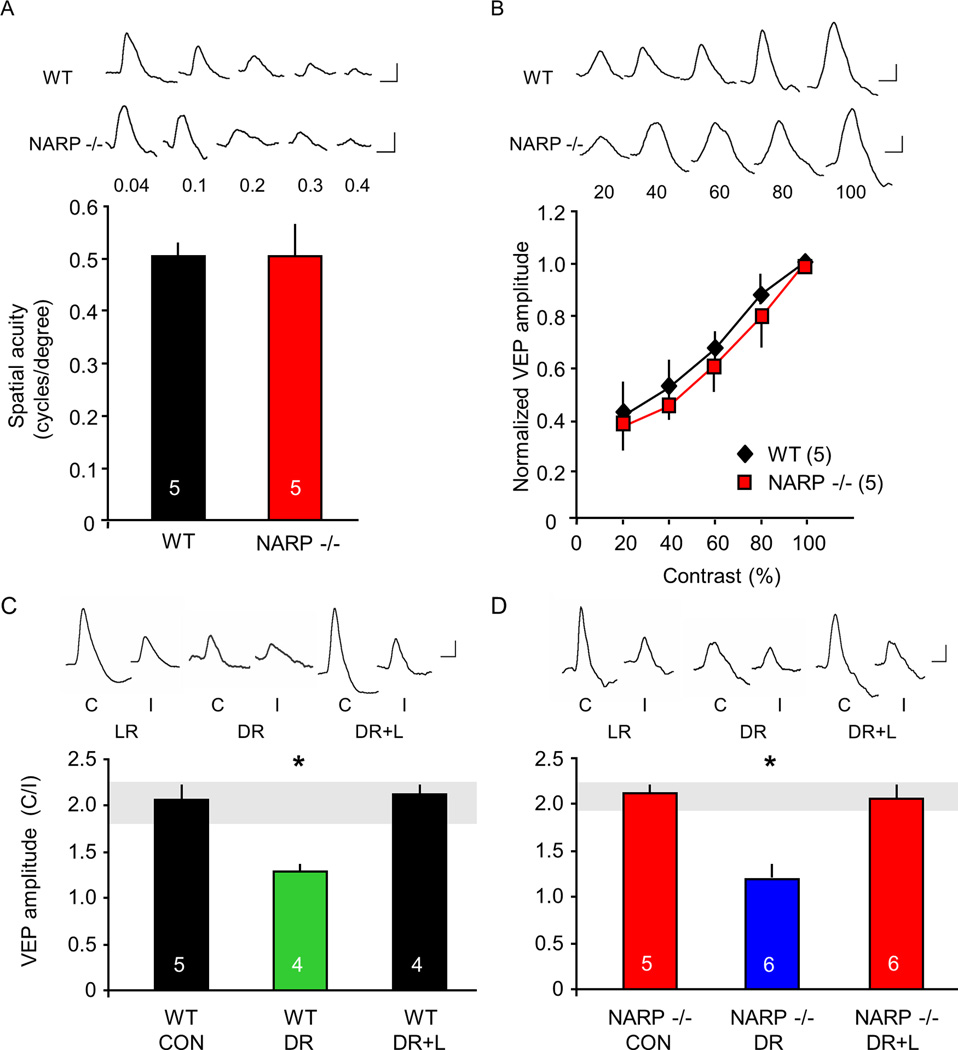
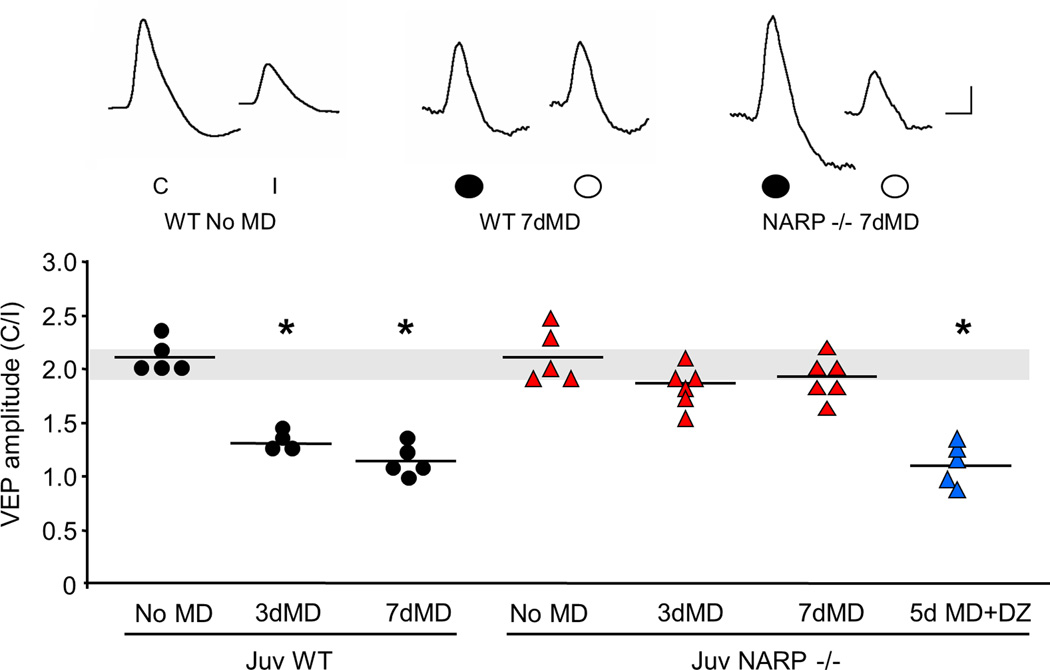
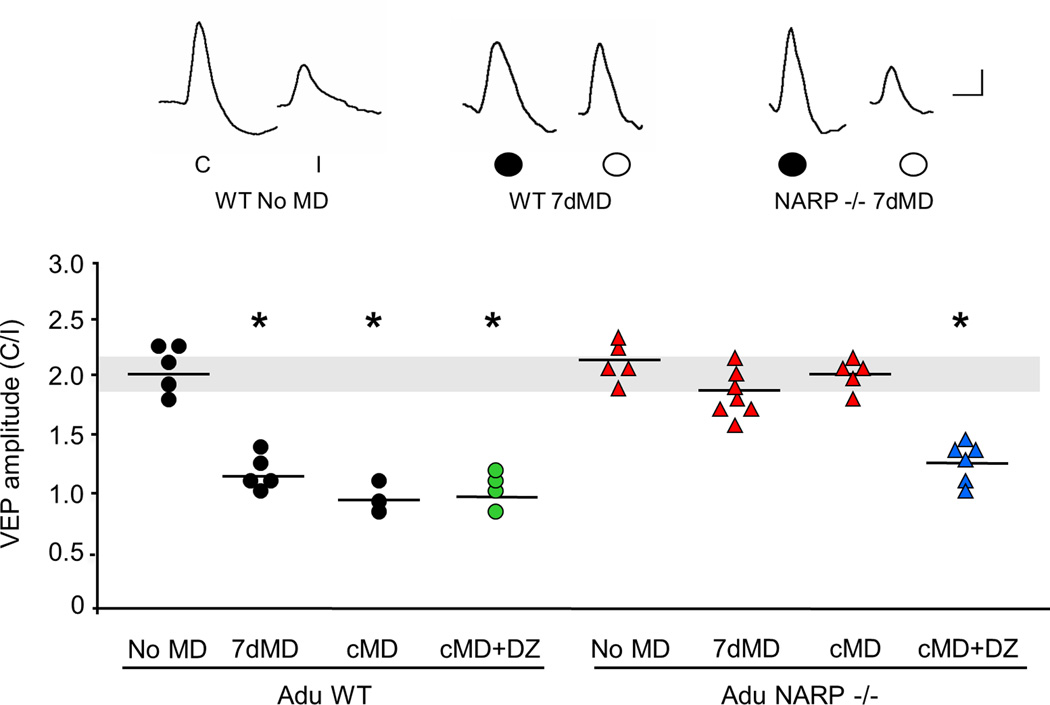
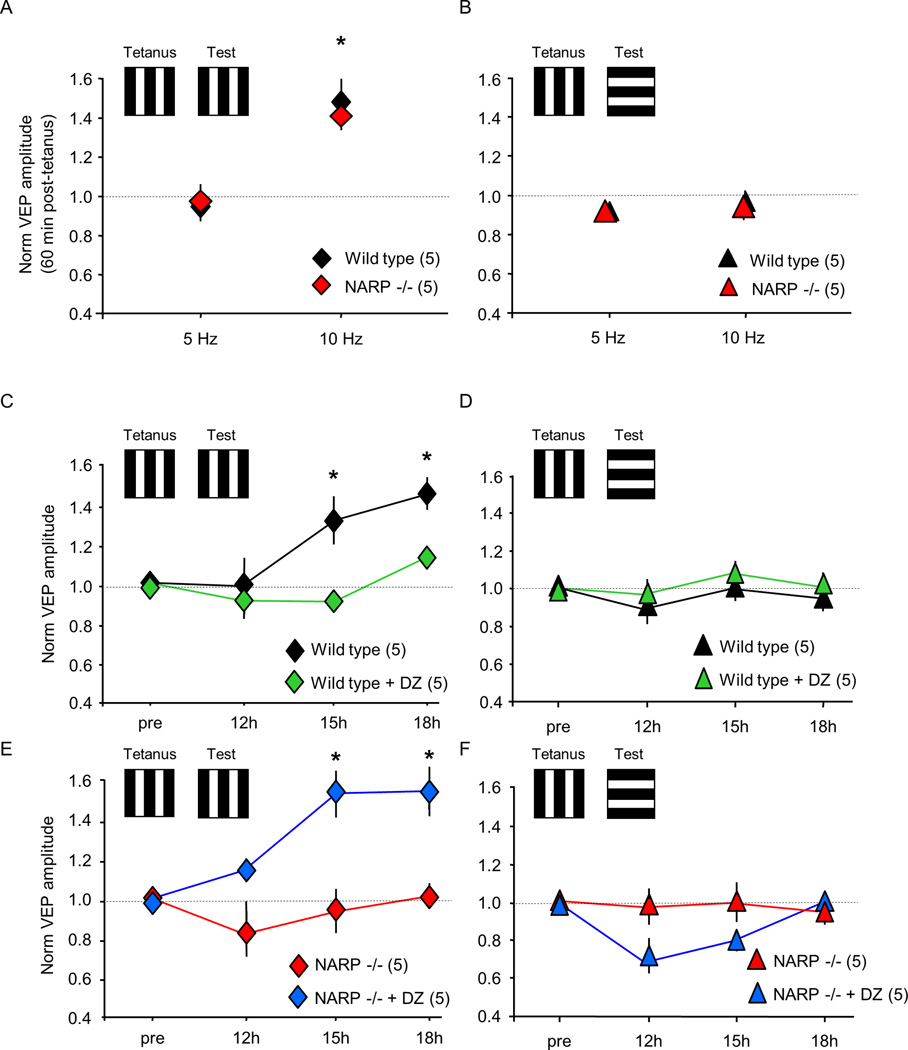
The immediate early gene neuronal activity-regulated pentraxin (NARP) is an α-amino-3-hydroxy-5-methyl-4-isoxazolepropionic acid receptor (AMPAR) binding protein that is specifically enriched at excitatory synapses onto fast-spiking parvalbumin-positive interneurons (FS [PV] INs). Here, we show that transgenic deletion of NARP decreases the number of excitatory synaptic inputs onto FS (PV) INs and reduces net excitatory synaptic drive onto FS (PV) INs. Accordingly, the visual cortex of NARP(-/-) mice is hyperexcitable and unable to express ocular dominance plasticity, although many aspects of visual function are unimpaired. Importantly, the number and strength of inhibitory synaptic contacts from FS (PV) INs onto principle neurons in the visual cortex is normal in NARP(-/-) mice, and enhancement of this output recovers the expression of experience-dependent synaptic plasticity. Thus the recruitment of inhibition from FS (PV) INs plays a central role in enabling the critical period for ocular dominance plasticity.


Figures

Fig 1
Fig 1. Altered connectivity between layer II/III pyramidal neurons and FS (PV) INs in the visual cortex of NARP −/− mice
A–F. uEPSCs in FS (PV) IN (green) evoked by action potentials in a nearby pyramidal neuron (grey). A. Experimental schematics B. Average of all responses recorded in connected Pyr->FS (PV) IN pairs (20 responses per pair) from P21-P25 NARP−/− (red) and age-matched wild type mice (black). Top: Action potentials in pyramidal neurons: bottom: uEPSCs in FS (PV) INs. Calibration Bar: 50 mV, 50 pA, 10 msec. C. Average uEPSC evoked with paired pulse stimulation, normalized to 1st uEPSC (NARP−/−: red, WT: black). D-F. Effects of NARP deletion on the probability of finding a connected pair (D), the uEPSC amplitude (E), and the paired pulse response ratio (F). G-L. uIPSCs in pyramidal neuron (grey) evoked by action potentials in a nearby FS (PV) IN (green). G. Experimental schematics H. Average of all responses recorded in connected FS (PV) IN -> Pyr neuron pairs (20 responses per pair). Top: Action potentials in FS (PV) INs; bottom: uIPSCs in pyramidal neurons. Calibration Bar: 40 mV, 40 pA, 10 msec. I. Average uIPSC evoked with paired pulse stimulation, normalized to 1st uIPSC (NARP−/−: red, WT: black). J-L. Effects of NARP deletion on the probability of finding a connected pair (J), the uIPSC amplitude (K), and the paired pulse response ratio (L). The number of mice and cell pairs is presented in each bar. *=p<0.01, t-test
Fig 2
Fig 2. NARP deletion reduces the number of release sites and increases the release probability at Pyr to FS (PV) IN connections
A. Representative experiment illustrating the estimation of synaptic parameters through a mean variance analysis of uEPSCs evoked by 50 Hz trains (of 10 pulses). 15 consecutive trials (grey) are superimposed, along with averaged response (black). Scale bars: 200 mV, 200 pA, 20 msec. Expanded uEPSCs, indicated by arrows, were evoked by the 2nd and 5th pulse of the trains. B. The relationship between mean uEPSC amplitude and variance for each of the 10 uEPSCs within the train was fitted with a parabola. C-E. Synaptic parameters estimated from the parabolic fit (see methods) in NARP−/− (red) and WT mice (black) include the number of release sites (C), the release probability (D), and the quantal size (E). The number of mice and cell pairs is presented in each bar. *=p<0.01, t-test.
Fig 3
Fig 3. Normal inhibitory input onto pyramidal cell but reduced excitatory input onto FS (PV) INs in NARP−/− mice
A–C. Extracellularly-evoked IPSCs (eIPSCs) recorded in pyramidal neurons are normal in P35 NARP−/− mice. A. Pharmacologically-isolated eIPSCs were recorded in layer II/III pyramidal neurons, evoked by extracellular stimulation of the underlying layer IV. B. Input-output relationship for eIPSCs in NARP−/− (red) and WT controls (black). C. Maximal IPSC computed by averaging eIPSC amplitudes evoked by the 3 largest stimulus intensities. D–F. Extracellularly- evoked EPSCs (eEPSCs) recorded in FS (PV) INs are reduced in P35 NARP−/− mice. D. Pharmacologically-isolated eEPSCs were recorded in layer II/III FS (PV) INs, evoked by extracellular stimulation of the underlying layer IV. E. Input-output relationship for eEPSCs in NARP−/− (red) and WT controls (black). F. Maximal EPSC computed by averaging eEPSC amplitudes evoked by the 3 largest stimulus intensities. Number of mice and neurons in parentheses in B and E. *=p<0.02; t-test.
Fig 4
Fig 4. Enhanced neuronal excitability in layer 2/3 of NARP −/− visual cortex
A. Representative raster plots of neuronal activity acquired in layer II/III of P28 visual cortex of wild type, NARP −/−, wild type + diazepam and NARP −/− + diazepam mice. In each case, activity is shown in response to visual stimulus in preferred orientation (1 Hz reversals of 0.04 cycles/degree; 100% contrast gratings, starting a time 0). B. Post-stimulus time histograms of average evoked activity of wild type and NARP −/− mice in response to visual stimulus in preferred orientation. Kruskal-Wallis H test, H=9.366, p=0.002. C. Post-stimulus time histograms of average evoked activity of wild type +diazepam and NARP −/− + diazepam in response to visual stimulus in preferred orientation. Kruskal-Wallis H test, H=21.01, p<0.001. D. Median evoked activity from layer II/III of P28 visual cortex of wild type, NARP −/−, wild type + diazepam and NARP −/− + diazepam mice. Kruskal-Wallis test, H(3)=37.812, p<0.001, *p<0.05 Mann-Whitney post hoc versus wild type controls. E. Time to peak evoked activity from layer II/III of P28 visual cortex of wild type, NARP −/−, wild type + diazepam and NARP −/− + diazepam. One way ANOVA, F3,57=8.449, p<0.001, *p<0.05 Bonferroni's post hoc versus wild type controls. F. Spike train duration from layer II/III of P28 visual cortex of wild type, NARP −/−, wild type + diazepam and NARP −/− + diazepam mice. One way ANOVA, F3,57=32.370, p<0.001, *p<0.05 Bonferroni's post hoc versus wild type controls.
Fig 5
Fig 5. Normal vision in NARP −/− mice
A. Comparable spatial acuity in NARP −/− mice and age-matched (P30) wild types. Spatial acuity is extrapolated from the linear regression of VEP amplitude versus spatial frequency of the visual stimulus. B. Comparable contrast sensitivity in NARP −/− mice and age-matched (P30) wild types. C. Two-fold VEP contralateral bias in P30 wild types (CON). Dark rearing (DR) from birth to P30 significantly inhibits the experience-dependent expression of VEP contralateral bias. Exposing dark-reared subjects to three days of normal lighted environment (DR+L) at P28 increases the VEP contralateral bias to the normal range (grey horizontal bar). One way ANOVA; F2,10=273.61, p<0.001. D. VEP contralateral bias is normal in P30 NARP −/− mice (CON). Dark rearing (DR) from birth to P30 significantly inhibits the experience-dependent expression of VEP contralateral bias. Exposing dark-reared subjects to three days of light (DR+L) at P28 increases VEP contralateral bias to the normal range (grey horizontal bar). One way ANOVA; F2,14=72.947, p<0.001; *p<0.01 Bonferroni’s post-hoc versus control. Inset: representative VEP waveforms. Scale bars: 50 ms, 50 µV.
Fig 6
Fig 6. Absence of ocular dominance plasticity in juvenile NARP −/− mice
Brief (3 days) and prolonged (7 days) monocular deprivation of the dominant, contralateral eye, induced a significant decrease in the VEP contralateral bias in juvenile (P25) wild type, but not NARP −/− mice. Diazepam (DZ, for 5 days initiated at P25) enabled ocular dominance plasticity in NARP −/− mice. One way ANOVA (F6,29=51.187, p<0.001); *p<0.05 Bonferroni's post hoc versus WT no MD control. Normal VEP contralateral bias is depicted by grey horizontal bar. Inset: representative VEP waveforms. C=contralateral eye, I=ipsilateral eye. Scale bars: horizontal 50 ms, vertical 50 µV.
Fig 7
Fig 7. Absence of ocular dominance plasticity in adult NARP −/− mice
Prolonged monocular deprivation (7 days) of the dominant, contralateral eye, initiated in adulthood (P90) and chronic monocular deprivation (from P21 – P100) induced a significant decrease in the VEP contralateral bias in adult wild type, but not NARP −/− mice. Diazepam (DZ, during the last 5 days of chronic MD) enabled ocular dominance plasticity in chronically- deprived NARP −/− mice, but does not change the ocular dominance shift in wild type mice. One way ANOVA (F7,32=18.706, p<0.001); *p<0.05 Bonferroni's post hoc versus WT no MD. Normal VEP contralateral bias is depicted by grey horizontal bar. Inset: representative VEP waveforms. C=contralateral eye, I=ipsilateral eye. Scale bars: 50 ms, 50 µV.
Fig 8
Fig 8. Differential response of NARP −/− mice to low versus high frequency visual stimulation
A. High frequency visual stimulation (10 Hz reversals of 0.04 cycle/degree 100% contrast vertical gratings) induced a rapid increase in VEP amplitude in P30 wild type and NARP −/− mice, but 5 Hz reversals were ineffective *=p<0.05 t-test versus pre-stimulation baseline. B. Enhancement of VEP amplitude following high frequency visual stimulation did not transfer to a visual stimulus of a novel orientation. C. Low frequency visual stimulation (1 Hz reversals of 0.04 cycle/degree 100% contrast vertical gratings) induced a slow increase in VEP amplitude in P30 wild type mice (black symbols), which was inhibited by diazepam (15 mg/kg, i.p; 30 mins prior to stimulation; green symbols). Two way repeated measures ANOVA: F1,8=18.288, p=0.003; *p<0.01 Bonferroni’s post hoc versus pre-stimulation. D. Enhancement of VEP amplitudes following low frequency visual stimulation did not transfer to a visual stimulus of a novel orientation. E. Low frequency visual stimulation (1 Hz reversals of 0.04 cycle/degree 100% contrast vertical gratings) did not change VEP amplitudes in P30 NARP −/− mice (red symbols). Administration of diazepam (30 mins prior to stimulation), enabled the enhancement of VEP amplitudes by low frequency visual stimulation (blue symbols; 15 mg/kg, i.p.). Two way repeated measures ANOVA: F1,8=12.247, p=0.008; *p<0.01 Bonferroni’s post hoc versus pre-stimulation. F. The enhancement of VEP amplitudes in NARP −/− mice by low frequency visual stimulation enabled by diazepam, did not transfer to a visual stimulus of a novel orientation.

References

    1. Artola A, Singer W. Long-term potentiation and NMDA receptors in rat visual cortex. Nature. 1987;330:649–652. - PubMed
    1. Ascoli GA, Alonso-Nanclares L, Anderson SA, Barrionuevo G, Benavides-Piccione R, Burkhalter A, Buzsaki G, et al. Petilla terminology: Nomenclature of features of GABAergic interneurons of the cerebral cortex. Nat Rev Neurosci. 2008;9:557–568. - PMC - PubMed
    1. Beste C, Wascher E, Güntürkün O, Dinse HR. Improvement and impairment of visually guided behavior through LTP- and LTD-like exposure-based visual learning. Curr Biol. 2011;21:876–882. - PubMed
    1. Bjartmar L, Huberman AD, Ullian EM, Rentería RC, Liu X, Xu W, Prezioso J, Susman MW, Stellwagen D, Stokes CC, Cho R, Worley P, Malenka RC, Ball S, Peachey NS, Copenhagen D, Chapman B, Nakamoto M, Barres BA, Perin MS. Neuronal pentraxins mediate synaptic refinement in the developing visual system. J Neurosci. 2006;26:6269–6281. - PMC - PubMed
    1. Chang MC, Park JM, Pelkey KA, Grabenstatter HL, Xu D, Linden DJ, Sutula TP, McBain CJ, Worley PF. Narp regulates homeostatic scaling of excitatory synapses on parvalbumin-expressing interneurons. Nat Neurosci. 2010;13:1090–1097. - PMC - PubMed

Publication types