. 2013 Jul 24;79(2):375-90.
doi: 10.1016/j.neuron.2013.05.023.

A biophysically detailed model of neocortical local field potentials predicts the critical role of active membrane currents

Affiliations

A biophysically detailed model of neocortical local field potentials predicts the critical role of active membrane currents

Michael W Reimann et al. Neuron. .

Abstract

Brain activity generates extracellular voltage fluctuations recorded as local field potentials (LFPs). It is known that the relevant microvariables, the ionic currents across membranes, jointly generate the macrovariables, the extracellular voltage, but neither the detailed biophysical knowledge nor the required computational power have been available to model these processes. We simulated the LFP in a model of the rodent neocortical column composed of >12,000 reconstructed, multicompartmental, and spiking cortical layer 4 and 5 pyramidal neurons and basket cells, including five million dendritic and somatic compartments with voltage- and ion-dependent currents, realistic connectivity, and probabilistic AMPA, NMDA, and GABA synapses. We found that, depending on a number of factors, the LFP reflects local and cross-layer processing. Active currents dominate the generation of LFPs, not synaptic ones. Spike-related currents impact the LFP not only at higher frequencies but below 50 Hz. This work calls for re-evaluating the genesis of LFPs.


Figures

Fig. 1
Fig. 1
Intra- and extracellular biophysics of individual neurons. (First row) 5,471 morphologically reconstructed and interconnected (left to right) L4 pyramids (red), 5,364 L5 pyramids (green) and 1,700 basket cells (blue). Circles indicate soma location and the depth axis is shown on the right. (Second row) Connectivity probability (bars) as a function of distance to the soma and neural type (corresponding to the top row). For example, the probability that a basket cell is connected to a L4 pyramidal neuron located within 25 μm is approximately 0.16 (blue bar). (Bottom row) Extracellular action potentials around the cell body for the three neural types considered (left to right: L4 pyramids, L5 pyramids, L5 basket cell) induced by a brief (10 ms) intracellular somatic current pulse (grey: soma and dendrites; red: axons; see Methods). (Left panel) Transmembrane currents across all neural processes within a particular volume sum to make up the extracellular voltage fluctuations measured by an electrode (circles: isopotentials arising from two dendritic current sources). The line-source approximation is used to calculate the extracellular contribution of transmembrane currents across each cylindrical compartment (see Methods).
Fig. 2
Fig. 2
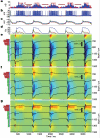
Simulated network activity. (a) External excitatory (red) and inhibitory (blue) synaptic input impinging on a L5 pyramid. The circa 15 million synapses were activated by independent Poisson processes with a rate fluctuating at 1 Hz between 3 and 15 events per second for excitation and 0.3 and 1.5 events for inhibition. This input, impinging on L4 and L5 pyramids, drives network activity. (b) Intracellular potential of three individual neurons (red: L4 pyramid; green: L5 pyramid; blue: L4 basket cell). (c) Mean intracellular somatic potential and (d) spike frequency (total number of spikes/total number of neurons/10 ms) as a function of time for all L4 (red), and L5 pyramids (green) and basket cells (blue). (e-g) LFP- and current source density (CSD)- dynamics for postsynaptic excitatory and inhibitory currents (e) in the extracellular space, (f) impinging along morphologically realistic neurons with passive or (g) with active membranes. LFP-traces are plotted in solid black at different locations along the depth axis (vertical depth is 1 mm). CSD shown along the depth axis (blue: sink; red: source). (Left) Soma density of L4 (red), L5 (green) pyramids and basket cells (blue) as a function of depth to indicate layering. (Right) Depth axis. Time axis, on the bottom, is identical for all panels.
Fig. 3
Fig. 3
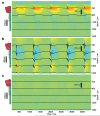
LFP- and CSD-contribution of individual cell populations. For the active conductance simulation shown in Fig. 2g, the LFP- and CSD-contribution of (a) L4 pyramidal neurons, (b) L5 pyramidal neurons and (c) L4/5 basket cells as a function of depth. CSD shown along the depth axis (blue: sink; red: source).
Fig. 4
Fig. 4
Comparison of the LFP depth profiles between active and passive membranes. (a) Average LFP- trace as a function of cortical depth during the mean UP-state (mean calculated over the five UP-states in Fig. 2) for passive (black; simulation in Fig. 2f) and active (red; simulation in Fig. 2g) membranes. The blue line indicates the 50 ms instant that analyses shown in panels b-d are based on. (b) The contribution of all neurons (black), layer 4 (red) and layer 5 pyramids (green) or L4/5 basket cells (blue) as a function of depth (circles: simulation results; line: best fit with double Gaussian function) in the center of the neural population for active membranes. (c) Same as panel (b) but for passive membranes. (d) Amplitude of the negativity (Aneg) and positivity (Apos), location (cneg and cpos, respectively) as well as the half-width of the LFP extrema (wneg and wpos, respectively) of the double Gaussian fits for active (red) and passive (black) membranes (see also Table S1). Color coding as in panels (b) and (c). (e) Comparison of network simulations with experimental data. (e, left) Mean CSD of simulation (time zero: UP-onset; Fig. 4a) with purely passive membrane conductances (simulation shown in Fig. 2f). (e, middle) Mean CSD of simulation including active membrane conductances (simulation shown in Fig. 2g). (e, right) Grand average (n=13 rats) CSD from recordings in rat somatosensory barrel cortex during single whisker deflections (Riera et al., 2012). The dashed vertical line on the left indicates the time instant for the whisker deflections. The position of L4 (red) and L5 (green) is indicated by the bars on the left and depth (in μm). The right panel is partly adopted from Riera et al. and aligned to the simulation CSDs so as to show the same depth coordinates (a L5 pyramid is shown on the right for comparison).
Fig. 5
Fig. 5
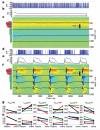
Two cases with altered synaptic input correlation driving L4 and L5 pyramidal neurons (compared to ‘control’ in Fig. 2): one with decreased (‘decorrelated’, panels a-c and g) and one with increased input correlation (‘super-synchronized’, panels d-f and h). (a) Intracellular potential of three individual neurons (red: L4 pyramid; green: L5 pyramid; blue: L4 basket cell). (b) Spiking frequency as a function of time for all L4 (red) and L5 pyramids (green) and basket cells (blue). (c) LFP- and CSD-dynamics resulting from decorrelated input impinging along morphologically realistic neurons with active membranes. (d-f) Same as panels a-c, respectively, for the ‘super-synchronized’ case. (g) Amplitude of the negativity (Aneg) and positivity (Apos), location (cneg and cpos, respectively) as well as the half-width of the LFP extrema (wneg and wpos, respectively) of the double Gaussian fits for active (red) and passive (black) membranes (see also Table S1) for the ‘uncorrelated’ (top) and ‘super-synchronized’ (bottom) case (same color coding as in Fig. 4d).
Fig. 6
Fig. 6
LFP-contribution as a function of lateral distance. (Left) L4 and (right) L5 pyramidal neuron population was separated in concentric cylinders of radii R. (Top) Cumulative contribution of each additional cylinder to the LFP-amplitude measured in the center of each population (red: active membranes; black: passive; circle: control input; star: uncorrelated input) with σ defined as the std of the LFP-signal during four UP-states. (Notably, σ differs from the LFP-amplitude definition in Figs. 4 and 5.) (Bottom) Re-scaled version of panels a-b with the LFP-amplitude expressed as fraction of the asymptotically reached amplitude (95% of the maximum value). The vertical distance R* where the LFP-amplitude equals 95% of the asymptotically reached LFP-amplitude is designated by blue triangles.
Fig. 7
Fig. 7
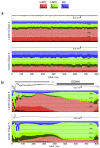
Ionic contributions to the LFP. Three types of LFP-contributions are considered: excitatory and inhibitory postsynaptic currents (synaptic) as well as Na-related (NA) and K-related (K) membrane currents as measured in the center of L4 (top) and L5 (bottom). Ca-related currents were also calculated but their contribution was small (less than 2.5%) and are neglected. Temporal binning is 10 ms. To calculate the contribution at the time bin of interest, the synaptic and active charge contribution (return currents are not included) of a particular neural population is weighted by the distance. In a second step, we normalized the contribution to the LFP-amplitude generated by the population as shown in Fig. 3. (The reason for the second step is to ensure the sum of Na-, K- and synaptic contributions of a cell type population equals the total contribution of that population to the overall LFP.) For example, the contribution of Na-related conductances of L5 pyramids is the total charge moved across the membrane via active Na-conductances during a particular time bin weighted by the inverse of the distance to the electrode. Then, we divide the charge contributed by Na-related conductances by the total charge contributed by all conductances of L5 pyramids. The contribution of the three cell types is considered separately: L4 pyramidal neurons (red), L5 pyramidal neurons (green) and basket cells (blue). The data is presented in form of relative (stacked) percentual contributions. (a) The results for the ‘uncorrelated’ simulation (Fig. 5a-c). (b) The results for the ‘control’ simulation (Fig. 2f). Notably, inhibitory postsynaptic currents contribute approximately 10% of the total synaptic contribution, i.e., excitatory input dominates the synaptic contribution.
Fig. 8
Fig. 8
Frequency- and distance-scaling of the LFP. (a) A 2 s long period of the Ve-recording conducted in the middle of L5 for (top to bottom) uncorrelated, control and super-correlated input (blue: only PSC contribute toward the LFP; black: passive membrane; red: active membrane contributes to the LFP). (b) PSD frequency scaling for the control input simulation (line: mean PSD of seven recordings from L4 and L5; see Fig. 2; shaded line: s.e.m.) Broken horizontal lines indicate slopes of α=2, 3 and 4. The vertical broken line indicates f=40 Hz. (c) PSD frequency scaling-exponent α as a function of network state (top, fit for <40 Hz; bottom, 40-1000 Hz; circle: mean; error bar: std). Quality-of-fit was assessed via the normalized RMS error and linear correlation and was good for all cases (Table S2) so that α-values accurately depict power-scaling in the designated frequency bandwidths. (d) Ve-recordings from an individual L5 pyramid at three locations within L5 (voltage traces are clipped). (e) PSD frequency scaling of individual L5 pyramidal neuron Ve-contribution (bandwidth: 25-1000 Hz; line: mean; shaded area: s.e.m.; broken lines show slopes of 2, 3 and 4) for the three locations shown in panel (d). (f) The value of frequency scaling exponent β indicates the frequency scaling of L5 pyramidal neurons at the single-neuron level as a function of network state (circle: mean; error bar: std; lines of the same color report β in the three locations). (g) Ve-signal originating from a single L5 pyramidal neuron (same as in the middle of d) filtered at (top to bottom) <50 Hz, 50-100 Hz and high pass (>800 Hz). (h) The PSD of the filtered Ve traces shown as a function of distance of the recording electrode from each L5 pyramidal neuron (line: mean; shaded area: s.e.m.) For passive membranes, PSD scales differently as a function of distance for distances larger vs. smaller than 100 μm. Broken lines indicate slopes γ=2, 3 and 4. (i) Distance scaling exponent γ denoting distance scaling of the Ve-contribution of L5 pyramidal neurons at the single-neuron level as a function of network state (circle: mean of the three bandwidths; error bar: std) for distances larger (top) or smaller (bottom) than 100 μm.

References

    1. Achermann P, Borbély A. Low-frequency (<1 Hz) oscillations in the human sleep electroencephalogram. Neuroscience. 1997;81:213–222. - PubMed
    1. Anastassiou CA, Montgomery SM, Barahona M, Buzsáki G, Koch C. The Effect of Spatially Inhomogeneous Extracellular Electric Fields on Neurons. J. Neurosci. 2010;30:1925–1936. - PMC - PubMed
    1. Anastassiou CA, Perin R, Markram H, Koch C. Ephaptic coupling of cortical neurons. Nat. Neurosci. 2011;14:217–223. - PubMed
    1. Angulo MC, Rossier J, Audinat E. Postsynaptic glutamate receptors and integrative properties of fast-spiking interneurons in the rat neocortex. J. Neurophysiol. 1999;82:1295–1302. - PubMed
    1. Bedard C, Kroger H, Destexhe A. Modeling Extracellular Field Potentials and the Frequency-Filtering Properties of Extracellular Space. Biophys. J. 2004;86:1829–1842. - PMC - PubMed

Publication types