. 2013 Jul 26;5(7):68.
doi: 10.1186/gm472. eCollection 2013.

Pathprinting: An integrative approach to understand the functional basis of disease

Affiliations

Pathprinting: An integrative approach to understand the functional basis of disease

Gabriel M Altschuler et al. Genome Med. .

Abstract

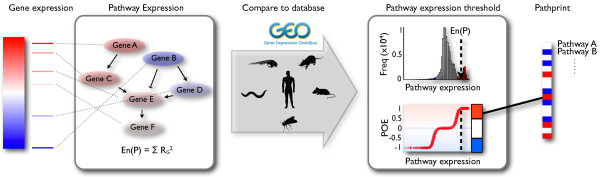
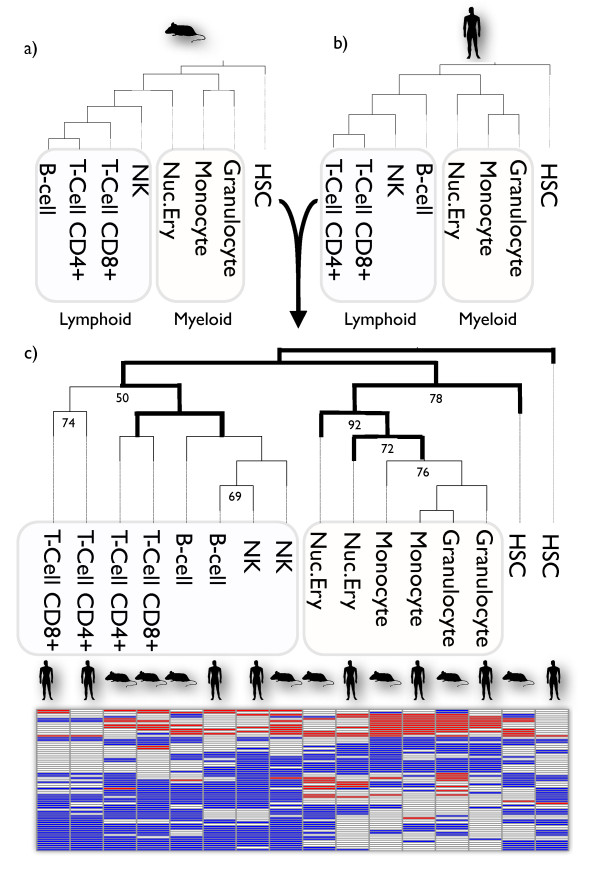
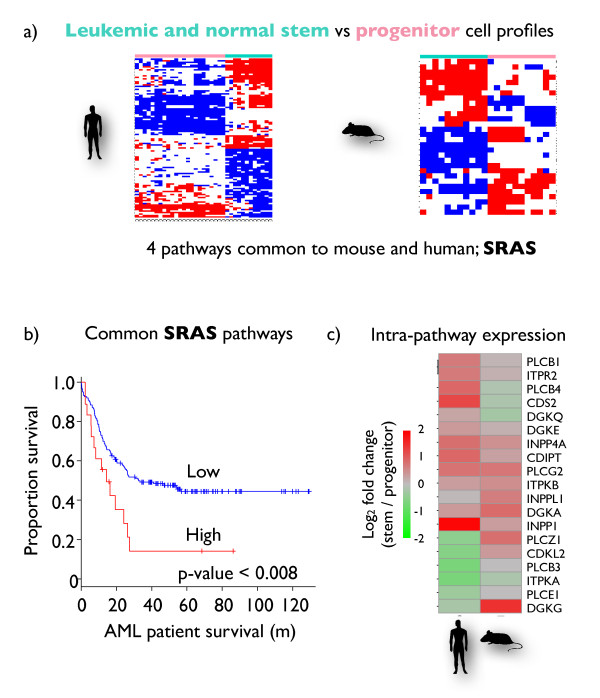
New strategies to combat complex human disease require systems approaches to biology that integrate experiments from cell lines, primary tissues and model organisms. We have developed Pathprint, a functional approach that compares gene expression profiles in a set of pathways, networks and transcriptionally regulated targets. It can be applied universally to gene expression profiles across species. Integration of large-scale profiling methods and curation of the public repository overcomes platform, species and batch effects to yield a standard measure of functional distance between experiments. We show that pathprints combine mouse and human blood developmental lineage, and can be used to identify new prognostic indicators in acute myeloid leukemia. The code and resources are available at http://compbio.sph.harvard.edu/hidelab/pathprint.


Figures

Figure 1
Figure 1
The Pathprint pipeline. Rank-normalized gene expression is mapped to pathway expression. A distribution of expression scores across the Gene Expression Omnibus (GEO is used to produce a probability of expression (POE) for each pathway. A pathprint vector is derived by transformation of the signed POE distribution into a ternary score, representing pathway activity as significantly underexpressed (-1), intermediately expressed (0), or overexpressed (+1).
Figure 2
Figure 2
Cross-species integration. (a) Precision recall within the tissue training dataset for the pathprint (red indicates mean average precision (MAP) = 0.90), unthresholded POE (dashed; MAP =, 0.88), random gene sets (black, MAP = 0.83), Gene Expression Barcode (blue, MAP = 0.73), Spearman gene expression correlation (green, MAP = 0.71). (b) Comparison of distance metrics; precision-recall curves for aggregated mouse to human tissue data based on a thresholded pathprint build produced using Euclidean (blue), Manhattan (green), and Mahalanobis (red) distances. (a,b) Tissue-dominated versus platform/species-dominated clustering showing plots of the two most significant principal components (PCs) for (c) the pathprint and (d) the Gene Expression Barcode (red, brain; yellow, kidney; green, liver; light blue, lung; dark blue, muscle; pink, spleen; circles, Mouse 430A2; diamonds, Human 133plus2; crosses Human 133A). (e) Functional classification of tissues and blood cell types. Hierarchical clustering of consensus pathprints for human and mouse tissues on three platforms based on the Wikipathway and Reactome pathways that significantly contributed to clustering. Colors indicate scores: red, 1; white, 0; and blue, -1).
Figure 3
Figure 3
Functional classification of blood cell types. (a) Maximum-parsimony phylogenetic reconstruction of the hematopoietic lineage using pathprints calculated from (a) human [40] and (b) mouse [41] gene expression experiments. (c) Combined human-mouse tree based on shared informative pathways that resolve trees (a) and (b) and the pathway heat-map. The myeloid (yellow) and lymphoid (purple) branches are indicated, and dark branches represent agreement with the canonical lineage. See Additional file 10 for pathway annotations.
Figure 4
Figure 4
Clinically important self renewal-associated signature (SRAS) in acute myeloid leukemia (AML). (a) Pathways differentially expressed in stem and non-stem cell profiles in leukemic and normal samples were found in human and mouse experiments. Four common SRAS pathways were identified. (b) The SRAS pathprint scores of patients with AML were significantly associated with survival. (c) A single pathway of interest is highlighted, the overall PGCL2 (α 2u globulin) module is upregulated in normal and cancer stem cells but individual genes differ between species. This pathway is strongly associated with survival (see Additional file 13).

References

    1. Wang X, Gulbahce N, Yu H. Network-based methods for human disease gene prediction. Brief Funct Genomics. 2011;5:280–293. doi: 10.1093/bfgp/elr024. - DOI - PubMed
    1. Liu Y, Koyuturk M, Barnholtz-Sloan JS, Chance MR. Gene interaction enrichment and network analysis to identify dysregulated pathways and their interactions in complex diseases. BMC Syst Biol. 2012;5:65. doi: 10.1186/1752-0509-6-65. - DOI - PMC - PubMed
    1. Yang X. Use of functional genomics to identify candidate genes underlying human genetic association studies of vascular diseases. Arterioscler Thromb Vasc Biol. 2012;5:216–222. doi: 10.1161/ATVBAHA.111.232702. - DOI - PubMed
    1. Yang X, Zhang B, Zhu J. Functional genomics- and network-driven systems biology approaches for pharmacogenomics and toxicogenomics. Curr Drug Metab. 2012;5:952–967. doi: 10.2174/138920012802138633. - DOI - PubMed
    1. Ala U, Piro RM, Grassi E, Damasco C, Silengo L, Oti M, Provero P, Di Cunto F. Prediction of human disease genes by human-mouse conserved coexpression analysis. PLoS Comput Biol. 2008;5:e1000043. doi: 10.1371/journal.pcbi.1000043. - DOI - PMC - PubMed