. 2013 Jul 25;39(1):184-95.
doi: 10.1016/j.immuni.2013.06.015.

γδ T cells exhibit multifunctional and protective memory in intestinal tissues

Affiliations

γδ T cells exhibit multifunctional and protective memory in intestinal tissues

Brian S Sheridan et al. Immunity. .

Abstract

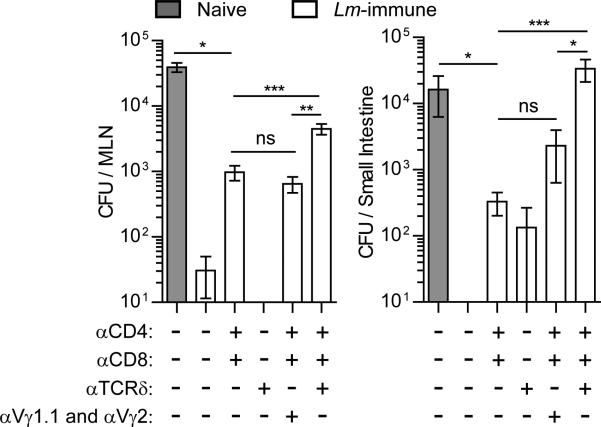
The study of T cell memory and the target of vaccine design have focused on memory subsumed by T cells bearing the αβ T cell receptor. Alternatively, γδ T cells are thought to provide rapid immunity, particularly at mucosal borders. Here, we have shown that a distinct subset of mucosal γδ T cells mounts an immune response to oral Listeria monocytogenes (Lm) infection and leads to the development of multifunctional memory T cells capable of simultaneously producing interferon-γ and interleukin-17A in the murine intestinal mucosa. Challenge infection with oral Lm, but not oral Salmonella or intravenous Lm, induced rapid expansion of memory γδ T cells, suggesting contextual specificity to the priming pathogen. Importantly, memory γδ T cells were able to provide enhanced protection against infection. These findings illustrate that γδ T cells play a role with hallmarks of adaptive immunity in the intestinal mucosa.


Figures

Figure 1
Figure 1. A distinct Lm-elicited γδ T cell subset is maintained into immunologic memory and recalls to secondary challenge
(A and B) Representative contour plots are gated on γδ T cells (identified by staining with GL3, a Cδ TCR-specific mAb) from MLN (A) or pLN (B) on indicated dpi. Values represent the percentage of cells within the indicated gates. See also Figure S1. (C) Representative histograms gated on total naïve γδ T cells or indicated subsets from 10 dpi mice from MLN were analyzed for expression of the indicated Vγ or Vδ regions. Values corresponding to the percentage of cells within the gated population are shown. (D) Two distinct gating strategies can identify Lm-elicited γδ T cells. Representative contour plots of γδ T cells from 9 dpi MLN were analyzed for CD27, CD44, Vγ1.1, 2, 3, and 5, and CD8α. Values corresponding to the percentage of cells within the gated population are shown. (E) 17D1 identifies Vγ4Vδ1 expressing T cells following preincubation with GL3. γδ T cells from MLN of memory mice and memory mice given a secondary oral infection were characterized for CD27 and CD44 expression and 17D1 reactivity. Red contour represents CD27 CD44hi γδ T cells while blue contour represents CD27+ γδ T cells.
Figure 2
Figure 2. Mobilization of Lm-elicited γδ T cells results in accumulation within intestinal LP but not within the epithelium
(A and B) Blood was collected from Lm infected mice and analyzed for GL3, Vγ chain (A), and α4β7 (B) expression. Mice were given a secondary Lm infection at 30 dpi and monitored for an additional 11 days with 3 – 5 mice per group. Subsets labeled Vγ4 specifically refers to γδ T cells which do not express Vγ1.1, 2, 3, or 5. Data is represented as mean ± SEM. See also Figure S2A. (C) Representative contour plots are gated on γδ T cells from pLN, MLN, LP, and IEL at the indicated times following infection. Values represent the percentage of cells within the indicated gates. Representative contour plots are shown from multiple experiments with 3 – 5 mice per group. (D) Representative contour plots gated on Vγ4+ CD8α γδ T cells (as indicated in (C)) from the MLN and LP were characterized for expression of CD44 and CD27 or CD127 and CD103. See also Figure S2B.
Figure 3
Figure 3. Lm-elicited γδ T cells display contextual specificity to the priming pathogen
(A) Mice infected 170 days previously were challenged either orally with 2×10¹⁰ CFU Lm or intravenously with 2×10⁵ Lm. MLNs were harvested at the indicated times following secondary infection to enumerate γδ T cells based on CD27 and CD44 expression. Data is displayed as mean ± SEM and representative of at least two independent experiments of 4 – 5 mice per group. See also Figure S3A-D. (B) Mice which had received a secondary infection were rested an additional 124 days prior to a tertiary oral Lm infection with 2×10¹⁰ CFU and γδ T cells were analyzed for CD27 and CD44 expression 5 days later (red squares represent individual mice). Data is represented as mean ± SEM. (C and D) γδ T cells from the MLN of oral Lm immune mice or oral Lm immune mice rechallenged by oral infection with Lm, S. typhimurium strain BRD509, or S. typhimurium strain SL1344 were analyzed 5 days later for (C) CD27 and CD44 expression and (D) α4β7 expression. Representative data is displayed as mean ± SEM from two independent experiments with 3 – 4 mice per group. See also Figure S3E.
Figure 4
Figure 4. Evolution of the cytokine response from Lm-elicited γδ T cells
(A and B) MLNs from naïve mice or mice infected with Lm were stimulated with αCD3 and αCD28-coated beads for 5 h in the presence of brefeldin A. γδ T cells were analyzed for CD27, CD44, IL-17A, and IFN-γ following stimulation. Representative dot plots from 3 – 5 mice per group and at least 2 experiments are displayed in (A) and represented as the mean ± SEM in (B). See also Figure S4. (C and D) MLNs from Lm infected mice were stimulated with beads as described for (A). γδ T cells were analyzed for IL-17A (C) and IFN-γ (D) following stimulation. Representative dot plots showing total CD3+ cells from 3 – 5 mice per group with values of the percentage of cells within gated quadrants displayed (upper panels). GL3 expression is determined from histograms gated on IL-17A (C) or IFN-γ (D) producing T cells from MLNs of infected mice. Numbers within histograms refer to the percentage of cells within the indicated gates. (E) MLNs were harvested from infected mice and γδ T cell subsets were analyzed for intracellular expression of T-bet and RORγt. Representative histograms are shown from 4 – 5 mice/group.
Figure 5
Figure 5. MHC II expressing cells substantially contribute to Lm-elicited γδ T cell effector functions
(A – D) 1×10⁶ MLN cells from Lm-immune Thy1.2 mice (A and B) or Lm-immune Thy1.2 mice 5 days following a secondary oral Lm infection (C and D) were mixed with 1×10⁶ MLN cells from Thy1.1 congenic mice as indicated above contour plots or left unstimulated. IL-17A and IFNγ production was determined by ICS of Thy1.2+ γδ T cells following 5 h in vitro in the presence of Brefeldin A. Red contour represents CD27 CD44hi Thy1.2+ γδ T cells while blue contour represents CD27+ Thy1.2+ γδ T cells. Values in contour plots represent the percentage of cytokine-producing cells from CD27 CD44hi γδ T cells. Data is representative of at least two independent experiments.
Figure 6
Figure 6. γδ T cells collaborate with αβ T cells to protect against secondary infection
Naïve mice or Lm-immune mice treated with the indicated combinations of GK1.5 (αCD4), 2.43 (αCD8), GL4 (αTCRδ), and 2.11 (αVγ1.1) and UC3-10A6 (αVγ2) were orally infected with 2×10¹⁰ CFU Lm. Bacterial burden was enumerated in the MLN and small intestine 4 days later. Data is presented as the mean ± SEM from 5 – 15 mice per group. *** p < 0.001, ** p < 0.01, * p < .05, ns p > 0.05. See also Figure S5.

Comment in

References

    1. Allison JP, Havran WL. The immunobiology of T cells with invariant γδ antigen receptors. Annu. Rev. Immunol. 1991;9:679–705. - PubMed
    1. Asarnow DM, Goodman T, Lefrancois L, Allison JP. Distinct antigen receptor repertoires of two classes of murine epithelium-associated T cells. Nature. 1989;341:60–62. - PubMed
    1. Begley M, Gahan CG, Kollas AK, Hintz M, Hill C, Jomaa H, Eberl M. The interplay between classical and alternative isoprenoid biosynthesis controls gammadelta T cell bioactivity of Listeria monocytogenes. FEBS Lett. 2004;561:99–104. - PubMed
    1. Bromson-Leeman S, Bronson RT, Dorf ME. Encephalitogenic T cells that stably express both T-bet and ROR gamma t consistently produce IFNgamma but have a spectrum of IL-17 profiles. J. Neuroimmunol. 2009;215:10–24. - PMC - PubMed
    1. Caccamo N, La MC, Orlando V, Meraviglia S, Todaro M, Stassi G, Sireci G, Fournie JJ, Dieli F. Differentiation, phenotype, and function of interleukin-17-producing human Vgamma9Vdelta2 T cells. Blood. 2011;118:129–138. - PubMed

Publication types

MeSH terms

Substances