. 2013 Jul 26;4(4):88.
doi: 10.1186/scrt247.

MicroRNA-21 promotes the ovarian teratocarcinoma PA1 cell line by sustaining cancer stem/progenitor populations in vitro

MicroRNA-21 promotes the ovarian teratocarcinoma PA1 cell line by sustaining cancer stem/progenitor populations in vitro

Wei-Min Chung et al. Stem Cell Res Ther. .

Abstract

Introduction: Resistance of cancer stem/progenitor cells (CSPCs) to chemotherapy can lead to cancer relapse. Ovarian teratocarcinoma (OVTC) arises from germ cells and comprises pluripotent cells that can be used to study cancer cell stemness. In this study, we evaluated whether microRNA-21 (miR-21) promotes ovarian teratocarcinoma by maintaining cancer stem/progenitor populations.

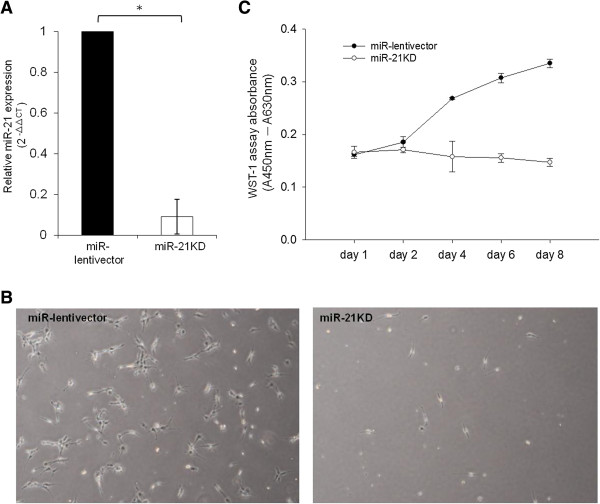
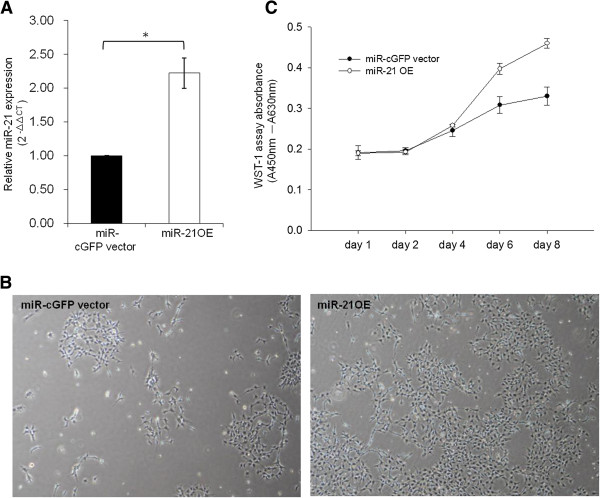
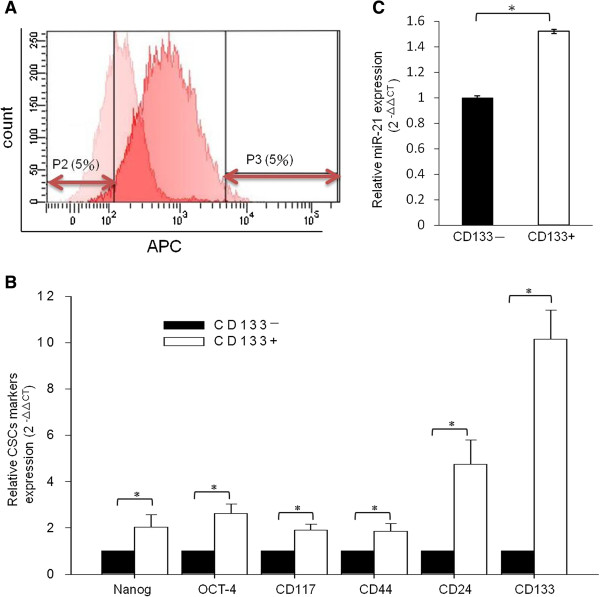
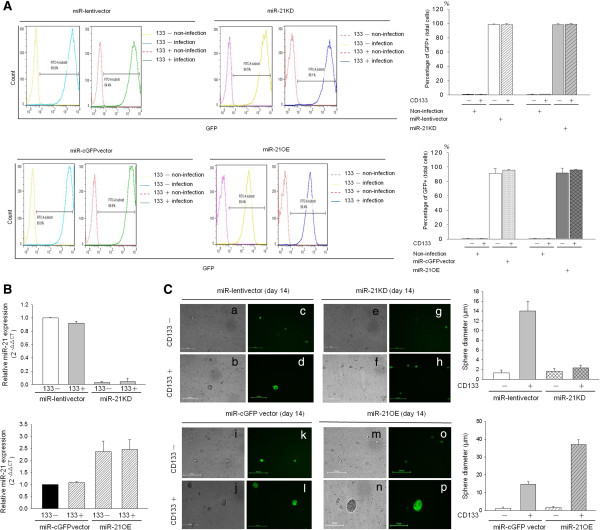
Methods: The lentiviral delivery system was used to upregulate or to suppress the expression of miR-21 in the human ovarian teratocarcinoma cell line PA1 and cell growth assays were used to monitor the expression of miR-21 at different time points. Antibodies directed toward CD133, a stem cell marker, were used to identify CSPCs in the PA1 cell population, and the level of miR-21 expression was determined in enriched CSPCs. Stem cell functional assays (sphere assay and assays for CD133 expression) were used to assess the effects of miR-21 on progression of the CD133+ population.

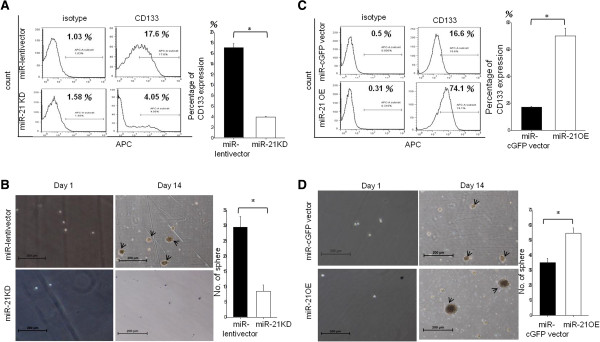
Results: Knockdown of miR-21 in PA1 cells attenuated growth of PA1 cells whereas overexpression of miR-21 promoted cell growth. Moreover, knockdown of miR-21 resulted in a marked reduction in the CD133+ population and sphere formation of CSPCs. In contrast, overexpression of miR-21 resulted in a marked increase in the population of CD133+ cells as well as sphere formation of CSPCs.

Conclusions: MicroRNA-21 plays a significant role in cancer growth by regulating stemness in cancer cells.


Figures

Figure 1
Figure 1
Knockdown of miR-21 inhibits PA1 cell growth. MiR-21 expression was significantly lower in PA1 cells infected with anti-miR-21 (miR-21 KD) than in cells infected with control (miR-lentivector) constructs. Relative expression of miR-21 was detected with quantitative real-time PCR and the relative amount of miR-21 is presented as the values of 2-ΔΔCt(A). Cell morphology and confluence of vector- or anti-miR-21-infected PA1 cells. Images were photographed on the sixth day of culture using a phase contrast fluorescence microscope (40×) (B). Cell growth WST-1 assays were performed at the indicated time points (one, two, four, six and eight days) and are shown on the X-axis. The Y-axis indicates the absolute absorbance (Abs.) values (Abs. at 450 nm deducted from Abs. at 630 nm background readings). The results shown are from three reproducible experiments (C). * indicates significance at P values less than 0.05. miR, microRNA.
Figure 2
Figure 2
Overexpression of miR-21 promotes PA1 cell growth. MiR-21 expression was significantly higher in PA1 cells infected with pre-miR-21 (miR-21 OE) than in cells infected with control (miR-cGFP vector) constructs. Relative expression of miR-21 was detected with quantitative real-time PCR and the relative amount of miR-21 is presented as the value of 2-ΔΔCt(A). Cell morphology and confluence of vector- or pre-miR-21-infected PA1 cells. Images were photographed on the fourth day of culture using a phase contrast fluorescence microscope (40×) (B). Cell growth WST-1 assays were performed at the indicated time points (one, two, four, six and eight days) and are shown on the X-axis. The Y-axis indicates the absorbance (Abs.) values (Abs. at 450 nm deducted from Abs. at 630 nm background readings). The results shown are from three reproducible experiments (C). * indicates significance at P values less than 0.05. miR, microRNA; OE: overexpression.
Figure 3
Figure 3
MiR-21 was up-regulated in CD133+ PA1 cell populations. APC-conjugated CD133 antibody was used to enrich CSPCs by FACS sorting. The basal IgG-isotype-APC staining signal peaks are presented on the left-hand side and the CD133-APC staining signal peaks are presented on the right-hand side of the histogram. As indicated in P2 and P3, the 5% extremes of the staining signal within the spectrum were sorted. Negatively stained cells (P2, left-hand side 5%) were defined as CD133- and positively stained cells (P3, right-hand side 5%) were defined as CD133+ cells (A). CSPC marker genes were examined using quantitative real-time PCR, and the relative amount of each CSPC marker was calculated as 2-ΔΔCt. The expression of Nanog, OCT-4, CD117, CD44, CD24, and CD133 in CD133– cells was compared with that of each gene in CD133+ cells. (B). MiR-21 expressed in CD133+ and CD133– cells. Quantitative real-time PCR was performed to detect expression of miR21. Expression of miR-21 in CD133– cells (basal level) was compared with the level of expression of miR-21 in CD133+ cells (C). The data in (B) and (C) represent the mean of three individual sets of experiments. The variations were from the calculation of standard deviation, and * indicates statistical significance at P-values less than 0.05. APC, allophycocyanin; CSPCs, cancer stem/progenitor cells; FACS, fluorescence-activated cell sorting; IgG, immunoglobulin G; MiR, micro RNA.
Figure 4
Figure 4
MiR-21 is essential for PA1 CSPCs self-renewal. Flow cytometric signal intensities were used to compare isotype-IgG-APC (left-hand side) and CD133-APC (right-hand side) in PA1 cells. Panel A shows the comparison of CD133+ populations in vector-infected cells (upper panel) and in anti-miR21-infected PA1 cells (lower panel). Sphere formation assay images of the PA1 cell colonies (black arrows indicate the tumor sphere). The sphere colony images were taken under a phase contrast fluorescence microscope (40×). The image on the left-hand side indicates vector-infected cells and the image on the right-hand side indicates anti-miR21-infected PA1 cell sphere colonies (B). Signal intensities of isotype-IgG-APC in PA1 cells (left-hand side) were compared with those of CD133-APC in PA1 cells (right-hand side). CD133+ populations in vector-infected PA1 cells (upper panel) were compared with those in pre-miR21-infected PA1 cells (lower panel) (C). Sphere formation assay images of the PA1 cell colonies (black arrows indicate the tumor sphere). The sphere colony images were taken using a phase contrast fluorescence microscope (40×). The image on the left-hand side indicates vector-infected cell sphere colonies and the image on the right-hand side indicates pre-miR21-infected PA1 cell sphere colonies (D). The scale bar represents 200 μm. APC, allophycocyanin; CSPCs, cancer stem/progenitor cells; IgG, immunoglobulin G; miR, microRNA.
Figure 5
Figure 5
MiR-21 is required for PA1 CD133+ CSPC function. Purified CD133– and CD133+ populations from miR-lentivector, miR-21 KD, miR-cGFPvector and miR-21 OE were collected and the percentage of green fluorescence expression was detected by flow cytometry. The percentage of green fluorescence expression of infected cells was compared with that of non-infected cells. Flow cytometric signal intensities of non-infected cells were compared with those of infected cell populations (left-hand side). The percentages of infected cells with green fluorescence are presented on the right-hand side (A). The relative expression of miR-21 in CD133+ and CD133– cells was detected using quantitative real-time PCR. Expression of miR-21 in CD133– cells (basal level) was compared with that of miR-21 expression in CD133+ cells (B). Sphere formation assay images of the CD133+ and CD133– population colonies. The sphere colony images were taken under a phase contrast fluorescence microscope (100×). The images in the upper panel indicate vector-infected cells (left-hand side) and those on the right-hand side indicate anti-miR21-infected cells. The images of visible light and green fluorescence in the lower panel indicate vector-infected cells (left-hand side) and those on the right-hand side indicate miR21 overexpression (C). The right panel represents quantitation of sphere diameters. Data in (A) and (B) represent the mean of three individual sets of experiments. The variations were from the calculation of standard deviation. The scale bar represents 50 μm. CSPC, cancer stem/progenitor cell; KD: knockdown miR, microRNA; OE.

Comment in

Similar articles

Cited by

References

    1. Garg M. MicroRNAs, stem cells and cancer stem cells. World J Stem Cells. 2012;4:62–70. - PMC - PubMed
    1. Liu J. Control of protein synthesis and mRNA degradation by microRNAs. Curr Opin Cell Biol. 2008;20:214–221. doi: 10.1016/j.ceb.2008.01.006. - DOI - PubMed
    1. Valencia-Sanchez MA, Liu J, Hannon GJ, Parker R. Control of translation and mRNA degradation by miRNAs and siRNAs. Genes Dev. 2006;20:515–524. doi: 10.1101/gad.1399806. - DOI - PubMed
    1. Chekulaeva M, Filipowicz W. Mechanisms of miRNA-mediated post-transcriptional regulation in animal cells. Curr Opin Cell Biol. 2009;21:452–460. doi: 10.1016/j.ceb.2009.04.009. - DOI - PubMed
    1. Krichevsky AM, Gabriely G. miR-21: a small multi-faceted RNA. J Cell Mol Med. 2009;13:39–53. - PMC - PubMed

Publication types