

Estimating population access to insecticide-treated nets from administrative data: correction factor is needed
- PMID: 23890257
- PMCID: PMC3726288
- DOI: 10.1186/1475-2875-12-259
Estimating population access to insecticide-treated nets from administrative data: correction factor is needed
Abstract
Background: Population access to insecticide-treated nets (ITN) is usually determined from survey data. However, for planning purposes it is necessary to estimate this indicator between surveys. Two different approaches are currently recommended for such estimates from administrative data, multiplying the number of ITN delivered either by 2.0 or 1.8 before dividing by the population. However, the validity of such estimates has not previously been investigated.
Methods: Thirty-five datasets from household surveys in sub-Saharan Africa were selected from ten different countries. The number of ITN and de-facto population from the samples was used as proxy administrative data and estimates of population access to ITN were calculated using the recommended formulae. Administrative estimates were compared to the access indicator from the survey data. Regression analysis was used to further define the relationship between administrative and survey population access. Mean number of ITN users was determined for each data set separately for households with and without enough ITN.
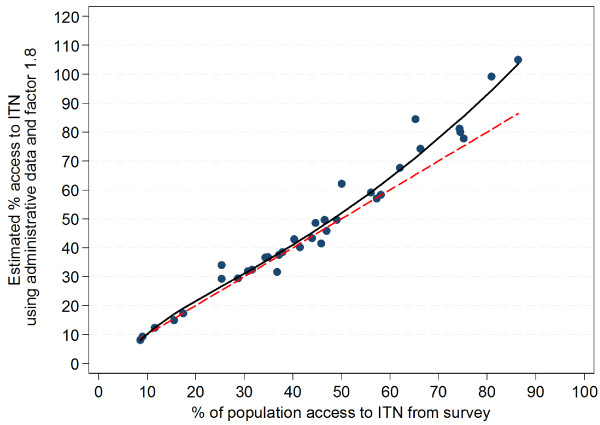
Results: Analysis of users per ITN showed that the assumption of two users per net is valid overall (median 2.00) but that it was consistently lower in households with at least one ITN for every two people (median 1.66). Using the formula number of ITN times 2.0 divided by the population to estimate population access to ITN from administrative data generally overestimated the survey access indicator. This was particularly the case at higher coverage levels, resulting in a 30 percentage-point overestimate at survey access above 80%. Using 1.8 as the multiplier for the number of ITN from administrative data improved the results but still showed a 19 percentage-point overestimate at access coverage above 80%. Regression analysis found that a factor of 1.64 provides the best prediction of the access indicator with slight underestimation at low access levels but good fit at levels above 55%.
Conclusions: A factor of 1.6 rather than 2.0 or 1.8 as the mean number of users per ITN provides a more accurate estimation of population access to ITN from administrative data accounting for discordant ITN-person pairs and a reduced number of ITN users when sufficient ITN are available.
Figures


References
-
- Roll Back Malaria Partnership. Global Malaria Action Plan. Geneva; 2008. http://www.rollbackmalaria.org/gmap/gmap.pdf.
-
- Global Malaria Programme. World Malaria Report 2012. Geneva: WHO; 2012. http://www.who.int/malaria/publications/world_malaria_report_2012/report....
-
- Roll Back Malaria Partnership. Changes to guidance for vector control indicators. New York, USA: Meeting report of the 17th MERG meeting; 2013. http://www.rbm.who.int/partnership/wg/wg_monitoring/docs/17merg_meeting_....
-
- Measure DHS. Malaria indicator survey: tabulations for key malaria indicators. Maryland, USA: Calverton; 2012. http://malariasurveys.org/toolkitfiles/10%20Tabulations%20for%20Key%20Ma....
-
- Alliance for Malaria Prevention. A toolkit for mass distribution campaigns to increase coverage and use of long-lasting insecticide-treated nets. 2012. http://www.allianceformalariaprevention.com/resources/AMP%20Toolkit%202.....
Publication types
MeSH terms
LinkOut - more resources
Full Text Sources
Other Literature Sources
Medical
