

Estimating the reproductive number in the presence of spatial heterogeneity of transmission patterns
- PMID: 23890514
- PMCID: PMC3735474
- DOI: 10.1186/1476-072X-12-35
Estimating the reproductive number in the presence of spatial heterogeneity of transmission patterns
Abstract
Background: Estimates of parameters for disease transmission in large-scale infectious disease outbreaks are often obtained to represent large groups of people, providing an average over a potentially very diverse area. For control measures to be more effective, a measure of the heterogeneity of the parameters is desirable.
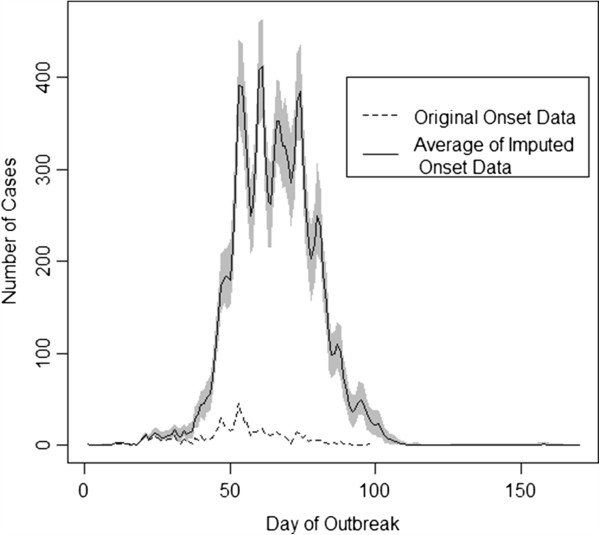
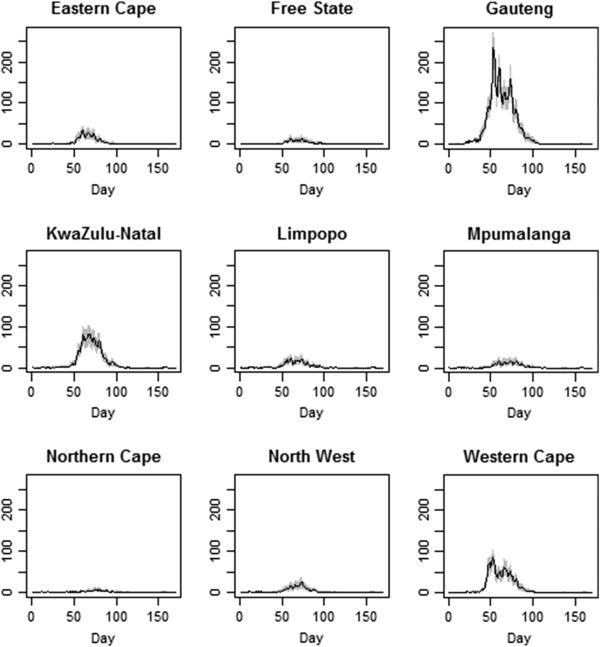
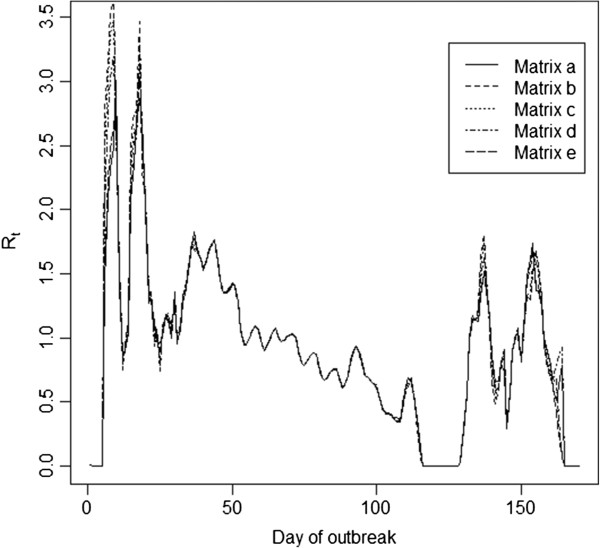
Methods: We propose a novel extension of a network-based approach to estimating the reproductive number. With this we can incorporate spatial and/or demographic information through a similarity matrix. We apply this to the 2009 Influenza pandemic in South Africa to understand the spatial variability across provinces. We explore the use of five similarity matrices to illustrate their impact on the subsequent epidemic parameter estimates.
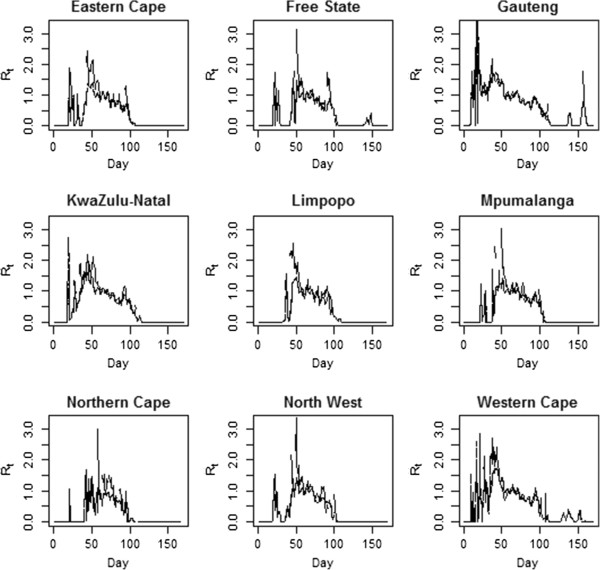
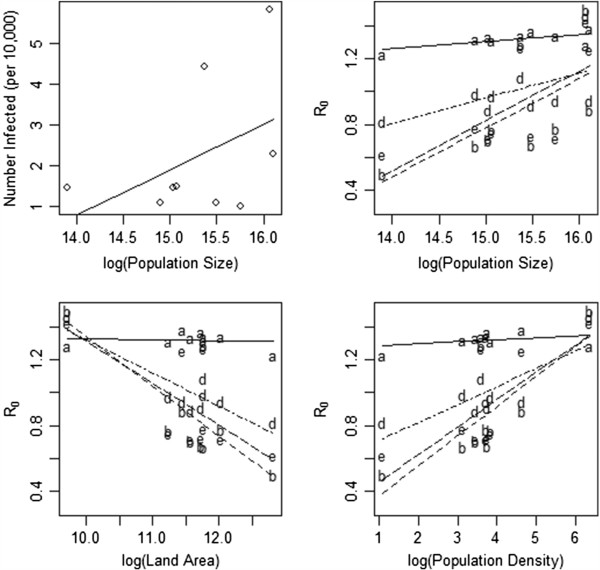
Results: When treating South Africa as a single entity with homogeneous transmission characteristics across the country, the basic reproductive number, R0, (and imputation range) is 1.33 (1.31, 1.36). When fitting a new model for each province with no inter-province connections this estimate varies little (1.23-1.37). Using the proposed method with any of the four similarity measures yields an overall R0 that varies little across the four new models (1.33 to 1.34). However, when allowed to vary across provinces, the estimated R0 is greater than one consistently in only two of the nine provinces, the most densely populated provinces of Gauteng and Western Cape.
Conclusions: Our results suggest that the spatial heterogeneity of influenza transmission was compelling in South Africa during the 2009 pandemic. This variability makes a qualitative difference in our understanding of the epidemic. While the cause of this fluctuation might be partially due to reporting differences, there is substantial evidence to warrant further investigation.
Figures
References
-
- Hahne S, Donker T, Meijer A, Timen A, van Steenbergen J, Osterhaus A. et al. Epidemiology and control of influenza A(H1N1)v in the netherlands: The first 115 cases. Euro Surveill. 2009;14(27):19267. - PubMed
-
- White LF, Wallinga J, Finelli L, Reed C, Riley S, Lipsitch M. et al. Estimation of the reproductive number and the serial interval in early phase of the 2009 influenza A/H1N1 pandemic in the USA. Influenza Other Respi Viruses. 2009;3(6):267–276. doi: 10.1111/j.1750-2659.2009.00106.x. - DOI - PMC - PubMed
Publication types
MeSH terms
Grants and funding
LinkOut - more resources
Full Text Sources
Other Literature Sources
Medical
