. 2013 Aug 15;4(3):413-419.
doi: 10.1016/j.celrep.2013.06.040. Epub 2013 Jul 25.

Motile axonal mitochondria contribute to the variability of presynaptic strength

Affiliations

Motile axonal mitochondria contribute to the variability of presynaptic strength

Tao Sun et al. Cell Rep. .

Abstract

One of the most notable characteristics of synaptic transmission is the wide variation in synaptic strength in response to identical stimulation. In hippocampal neurons, approximately one-third of axonal mitochondria are highly motile, and some dynamically pass through presynaptic boutons. This raises a fundamental question: can motile mitochondria contribute to the pulse-to-pulse variability of presynaptic strength? Recently, we identified syntaphilin as an axonal mitochondrial-docking protein. Using hippocampal neurons and slices of syntaphilin knockout mice, we demonstrate that the motility of axonal mitochondria correlates with presynaptic variability. Enhancing mitochondrial motility increases the pulse-to-pulse variability, whereas immobilizing mitochondria reduces the variability. By dual-color live imaging at single-bouton levels, we further show that motile mitochondria passing through boutons dynamically influence synaptic vesicle release, mainly by altering ATP homeostasis in axons. Thus, our study provides insight into the fundamental properties of the CNS to ensure the plasticity and reliability of synaptic transmission.


Figures

Figure 1
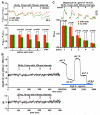
Figure 1. Axonal Mitochondrial Motility Correlates with the Pulse-to-Pulse Variation of EPSC Amplitudes
(A-C) Single trace (A) and superimposed traces of 30 sweeps (B) at 0.05-Hz stimulation and kymographs of axonal mitochondrial motility (C) from hippocampal neurons of snph+/+ or snph−/− mouse littermates, or WT neuron pairs, where presynaptic neurons expressing EGFP-SNPH, EGFP-SNPHΔMT, or GFP forming synapses with untransfected postsynaptic neurons. Mitochondria were labeled with DsRed-Mito (red). Neurons were transfected at DIV7-8; EPSCs were recorded 3 days after transfection. In kymographs, vertical lines represent stationary organelles; oblique lines or curves to the right indicate anterograde transport. (D) Axonal mitochondrial motility influences the pulse-to-pulse synaptic variability. 30 traces from each neuron pair were averaged and data in the same group were pooled to calculate the average mean peak EPSC amplitude (left). The CV of pulse-to-pulse EPSC amplitudes was analyzed from 30 sweeps (right). (E-G) Increasing mitochondrial motility enhanced synaptic fluctuations in acute hippocampal slices. Sample traces of the middle 30 EPSC events from 90 to 120 (E) and superimposed 200 EPSC events (F) and mean peak EPSC amplitude and relative CV values (G) from snph+/+ or snph−/− littermates (postnatal 3-5 weeks). Each recording was evoked by 0.05-Hz stimulation via the Schaffer collateral pathway. 200 sweeps form each slice were averaged and the data in the same group were pooled to calculate the mean peak EPSC amplitude. Data were collected from the total number of neurons (D) or slices (G) indicated within bars. Data sets (D) were analyzed by the non-parametric Kruskal-Wallis test (p=0.029) comparing the five groups. The Dwass-Steel-Critchlow-Fligner post hoc analysis was applied for multi-group comparison. The p values on top of bars (D) are pair-wise comparisons to snph+/+ neurons. Data sets were also log10 transformed to normalize distribution, followed by one-way ANOVA analysis and the Dunnett test for multi-group CV comparison of (D, p=0.027). Data sets (G) were analyzed using the non-parametric the Mann-Whitney test for two groups. Error bars: SEM. Scale bars in C: 10 μm.
Figure 2
Figure 2. Mitochondrial Motility Influences SV Release at Single-Bouton Levels
(A-D) Dual-color live imaging showing the distribution and motility of axonal mitochondria at boutons and corresponding spH traces (A-C) and normalized spH ΔFpeak (D) during four trains of stimulation (20-Hz at 10-sec with 100-sec interval). Note that SV exocytosis remained robust and stable at boutons with a stationary mitochondrion (red arrows/traces), while exocytosis diminished starting at the 2nd train at mitochondrion-free boutons (green arrows/traces) or when a mitochondrion is moving out of the bouton at the 3rd train (blue arrows/traces). A mitochondrion passing by bouton during the 3rd train rescued SV release (purple arrows/traces). (E-G) Mitochondrial motility influences ΔFpeak variability. CV values of the ΔFpeak variation at each bouton during repeated stimulation were quantified and then averaged over all the trains from each group of boutons (E) with (red) or without (green) a stationary mitochondrion, or with a motile mitochondrion (blue). Representative spH traces are shown in Figure S2C. Kymographs (F) and average CV values (G) reflect the trial-to-trial ΔFpeak variation at each bouton in snph+/+, snph−/−, or in neurons over-expressing SNPH or Miro1 (Kruskal-Wallis test for comparing all four groups: p<0.0001) (Also see Movie S2-S4). Data were collected from the number of neurons indicated in parentheses (D) or from the number of boutons indicated within bars (E, G) and analyzed by the non-parametric Kruskal-Wallis test for comparing multiple groups, followed by the Dwass-Steel-Critchlow-Fligner post hoc analysis for all pair-wise comparisons. The Mann-Whitney test was applied for pair-wise comparisons for two groups. Error bars: SEM. Scale bars in A-C: 1 μm; F: 10 μm.
Figure 3
Figure 3. Impact of Presyanptic Mitochondria on the Size of Releasable SV Pools
(A, B) Representative spH traces (A) and normalized ΔFpeak (B) before and after applying Baf (2 μM) at the fourth train of stimulation. (C, D) Representative spH traces (C) and step increase of ΔFpeak in response to each train (D) when applying Baf (2 μM) during repeated stimulation. Data were collected from 10-50 boutons from each neuron and analyzed by the Dwass-Steel-Critchlow-Fligner post hoc analysis for all pair-wise comparisons. The Mann-Whitney test was applied for pair-wise comparisons for two groups. Error bars: SEM.
Figure 4
Figure 4. ATP Homeostasis Is Critical to Maintain SV Release
(A) The cellular ATP/ADP ratio during trains of stimulation. The curve of fluorescence intensity (F488nm/F405nm) (upper panels) reflects the relative ATP/ADP ratio. Normalized F488nm/F405nm ratio (lower panels) was recorded before each train. (B) Measurement of axonal pH using SNARF-5F during trains of stimulation. 20-50 areas with or without a mitochondrion along each axon were selected for imaging. SNARF-5F was excited at 488 nm and detected around 580 nm and 640 nm during 4 trains of stimulation, as indicated by red bars (upper left). At the end of stimulation, SNARF-5F signal was calibrated using various buffered solutions containing high K/nigericin with varying pH values (blue bar, upper right). Calibrated pH values (lower panel) were averaged from 50 images. (C) Representative spH traces (upper) and normalized spH ΔFpeak (lower) showing reduced SV release at boutons with a stationary mitochondrion under treatment with 4μg/ml oligomycin for 15 min. Note that oligomycin reduced exocytosis at the 3rd stimulus at boutons with a mitochondrion (red), a phenotype similar to the bouton without a mitochondrion (green). Data were collected from 11 neurons (A) or 5 neurons (C). 10-50 boutons or axonal areas were imaged for each neuron. Data sets were analyzed by the non-parametric Kruskal-Wallis test for comparing multiple groups. The Mann-Whitney test was applied for pair-wise comparisons for two groups. Error bars: SEM.

References

    1. Atwood HL, Karunanithi S. Diversification of synaptic strength: presynaptic elements. Nat. Rev. Neurosci. 2002;3:497–516. - PubMed
    1. Berg J, Hung YP, Yellen G. A genetically encoded fluorescent reporter of ATP: ADP ratio. Nat. Methods. 2009;6:161–166. - PMC - PubMed
    1. Branco T, Staras K. The probability of neurotransmitter release: variability and feedback control at single synapses. Nat. Rev. Neurosci. 2009;10:373–383. - PubMed
    1. Chang DT, Honick AS, Reynolds IJ. Mitochondrial trafficking to synapses in cultured primary cortical neurons. J. Neurosci. 2006;26:7035–7045. - PMC - PubMed
    1. Chen YM, Gerwin C, Sheng ZH. Dynein light chain LC8 regulates syntaphilin-mediated mitochondrial docking in axons. J. Neurosci. 2009;29:9429–9438. - PMC - PubMed

Publication types

Substances