. 2013 Aug 21;79(4):782-97.
doi: 10.1016/j.neuron.2013.06.022. Epub 2013 Jul 25.

Natural scenes viewing alters the dynamics of functional connectivity in the human brain

Affiliations

Natural scenes viewing alters the dynamics of functional connectivity in the human brain

Viviana Betti et al. Neuron. .

Abstract

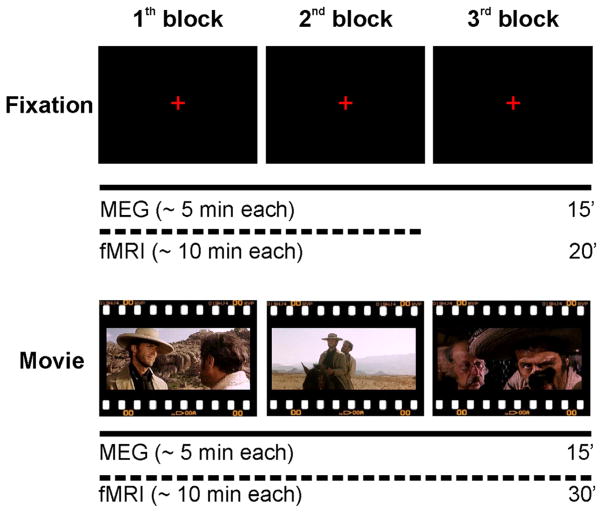
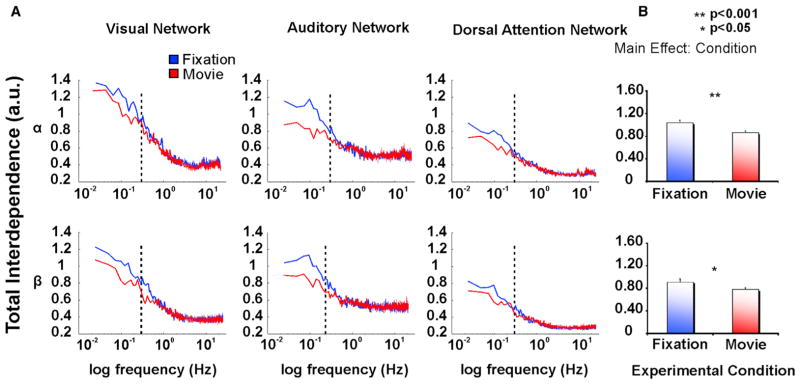
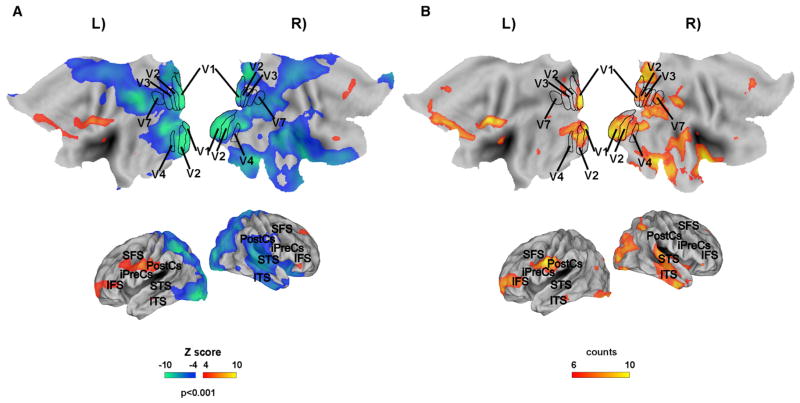
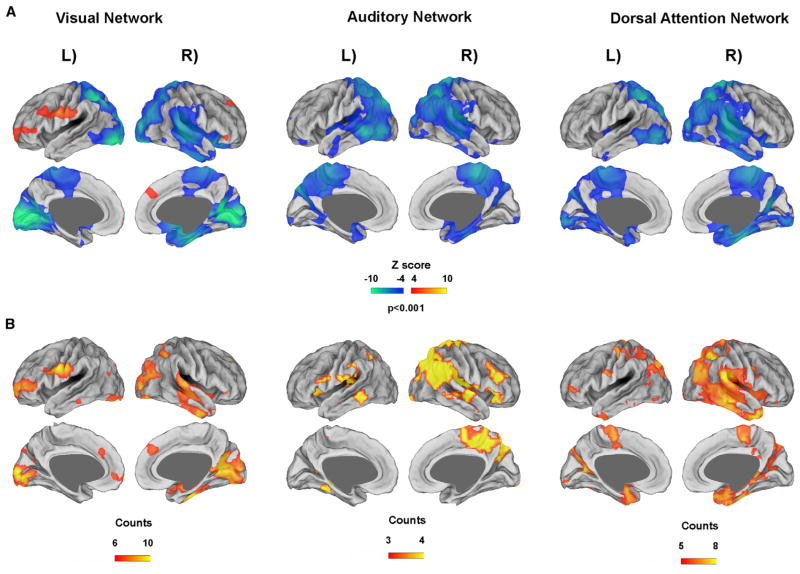
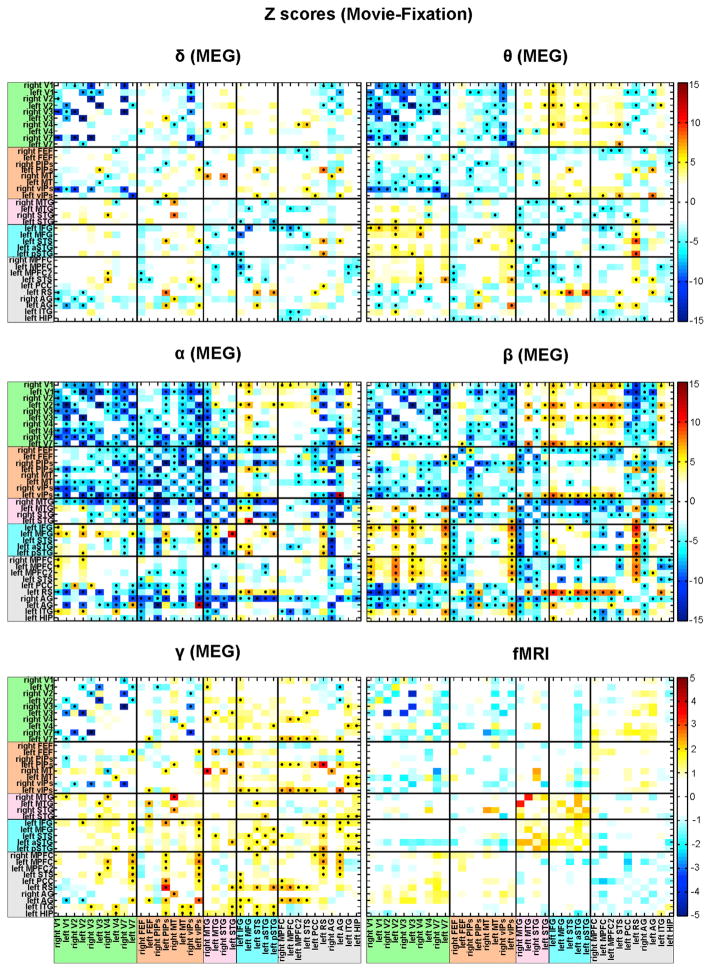
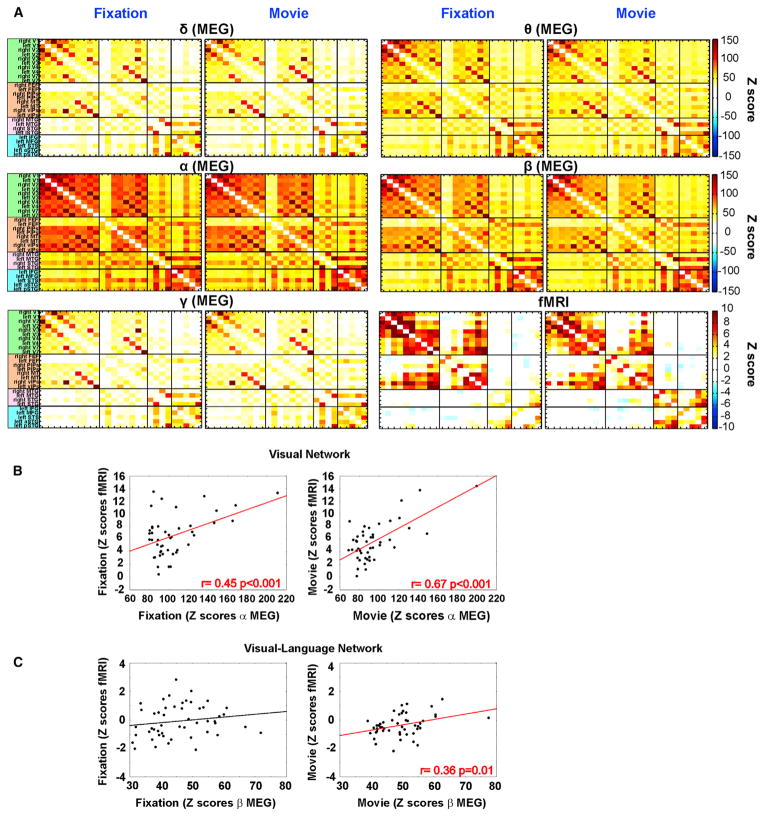
Spontaneous fMRI fluctuations are organized in large-scale spatiotemporal structures, or resting-state networks (RSN). However, it is unknown how task performance affects RSN dynamics. We use MEG to measure slow (∼0.1 Hz) coherent fluctuations of band-limited power (BLP), a robust correlate of RSN, during rest and movie observation and compare them to fMRI-RSN. BLP correlation, especially in α band, dropped in multiple RSN during movie although overall topography was maintained. Variability of power correlation increased in visual occipital cortex, and transient decrements corresponded to scenes perceived as "event boundaries." Additionally, stronger task-dependent interactions developed between vision and language networks in θ and β bands, and default and language networks in γ band. The topography of fMRI connectivity and relative changes induced by the movie were well matched to MEG. We conclude that resting-state and task network interactions are clearly different in the frequency domain despite maintenance of underlying network topography.


Figures

Figure 1
Figure 1. Schematic Representation of the Experimental Paradigm for the MEG and fMRI Recording Sessions
In separate sessions, MEG and fMRI recordings were acquired on the same participants during three blocks of visual fixation (fixation) and three movie segments taken from The Good, the Bad and the Ugly (movie). The order of MEG and fMRI recording sessions was counterbalanced across participants, while the order of the experimental conditions (fixation and movie) was fixed across subjects. See also Figure S1.
Figure 2
Figure 2. Reduction of Total Interdependence during Movie Watching for the Within-Network Interaction
(A) Total Interdependence on a semilog scale in the α and β BLP for the visual (left column), auditory (middle column), and dorsal attention (right column) Network obtained from nodes of each network and averaged over runs, separately for fixation (blue line) and movie (red line). In both α and β bands, the internodal within-network interdependence is stronger at lower (<0.3 Hz, dotted lines) than higher frequency bands, with a maximum peak at about 0.1 Hz during fixation. Movie watching decreases the internodal interaction in each network. (B) The statistically significant reduction of the total interdependence during movie among nodes within each network with respect to fixation, as revealed by the significant effect condition. Error bars indicate ± SEM. See also Figure S2, Figure S3, and Table S1.
Figure 3
Figure 3. Topographic Changes of Stationary MEG Connectivity in the α BLP Induced by Movie Watching, in the Visual Network
(A) Voxel-wise map showing the difference between movie and fixation obtained using different seed regions of the visual network averaged across runs and seeds, in the α BLP. Color scale reflects positive or negative modulations of Z score obtained from difference of correlation coefficients. (B) Consistency maps across different nodes of the visual network. Regions in yellow-orange and in green-blue show consistent changes in correlation (positive or negative, respectively) across multiple nodes of the visual network. The map displays at least 6 of 10 nodes (more than half nodes), which show significant temporal correlations (Z score equal or greater than 4, p < 0.001 in each node). Color scale represents number of nodes with significant correlation at that voxel. See also Figure S3 and Table S1.
Figure 4
Figure 4. Widespread Decrease of Stationary MEG Interregional Correlation Induced by Movie Watching across Different RSN
(A) Voxel-wise maps as in Figure 3 showing widespread modulations of functional connectivity elicited by movie watching across different RSN relative to fixation, for the visual network (left column), auditory network (in the middle), and the dorsal attention network (right column), in the α BLP. (B) Consistency maps across different nodes of the visual, dorsal attention, and auditory networks. Regions in yellow-orange and in green-blue show consistent changes in correlation (positive or negative, respectively) across multiple nodes in each RSN. The map displays more than half nodes (at least 6 of 10 nodes for the visual network; at least 3 of 4 nodes for the auditory network; at least 5 of 8 nodes for the dorsal attention network), which shows significant temporal correlations (Z score equal or greater than 4, p < 0.001 in each node). Color scale represents number of nodes with significant correlation at that voxel. See also Figure S4 and Table S1.
Figure 5
Figure 5. MEG and fMRI Covariance Matrices Showing Changes of Interregional Connectivity under Natural Vision by Nodes and Bands
Z scores difference covariance matrices showing changes of interregional correlation during movie watching relative to fixation, obtained using MEG across different BLPs and fMRI. Each row in the covariance matrices represents the stationary Z score difference correlation value between a node and other nodes of RSN. White cells represent nodes pairs, which do not pass the statistical threshold (z = 4 corresponding to p < 0.001). Cells with asterisks show significant value after the Bonferroni correction for multiple comparisons. See also Figure S5 and Table S1.
Figure 6
Figure 6. Z Score Difference Covariance Matrices Averaged across Nodes
Group-level Z score difference covariance matrices averaged across nodes of each RSN obtained using MEG across different BLPs and fMRI. Each row represents the averaged interregional Z score correlation between nodes either to the same RSN (within-network interaction) or to distinct networks (cross-network interaction). Color scale indicates increased in yellow-orange or decreased in green-blue interregional interaction. White cells represent nodes pairs, which do not pass the statistical threshold z = 2.4 (corresponding to p < 0.05). Cells with asterisks show significant value after the Bonferroni correction for multiple comparisons. See also Figure S6.
Figure 7
Figure 7. MEG BLP versus fMRI Covariance Structures
(A) Group-level Z score covariance matrices for fixation and movie by nodes for each MEG BLP and fMRI. Each row represents the interregional Z score correlation between nodes belonging either to the same RSN (within-network interaction) or to distinct networks (cross-network interaction). (B) Spatial correlation between MEG and fMRI covariance structures for the within-network interaction in visual network (fMRI-α BLP correlation), during fixation and movie. (C) Spatial correlation between MEG and fMRI covariance structures for the across-network interaction (fMRI-β BLP correlation) between the visual and the language network, during fixation and movie. See also Table S2.
Figure 8
Figure 8. Dependence of MEG Visual Network on Specific Movie Features
(A) Nonstationary α BLP correlation averaged across nodes of the visual network showing the emergence of significant local minima during the observation of the first movie block. (B) Power spectrum density (PSD) of correlation time course for fixation (the blue line) and movie (the red line) averaged across runs and nodes. Error bars indicate ± SEM. Movie watching increases the spectral variability of BLP correlation in α BLP in the slow (0.005–0.1 Hz, in green) and middle (0.1–0.2 Hz, in orange) frequency bands, as revealed by the significant interaction condition × band (in the insert). (C) Behavioral results showing the perceptual grouping processes across subjects, for the first movie block. Consistency analysis computed integrating the number of counts on 12 subjects as function of time shows that observers perceived natural scenes as structured into discrete events; BLP correlation and consistency measures were both binarized (panels D and E, respectively) to compute the lag cross-correlation (F). After the determination of a significant threshold (dashed lines) we identify two correlation peaks (see marks) at different time lags. See also Figure S7.

References

    1. Albert NB, Robertson EM, Miall RC. The resting human brain and motor learning. Curr Biol. 2009;19:1023–1027. - PMC - PubMed
    1. Arfanakis K, Cordes D, Haughton VM, Moritz CH, Quigley MA, Meyerand ME. Combining independent component analysis and correlation analysis to probe interregional connectivity in fMRI task activation datasets. Magn Reson Imaging. 2000;18:921–930. - PubMed
    1. Baldassarre A, Lewis CM, Committeri G, Snyder AZ, Romani GL, Corbetta M. Individual variability in functional connectivity predicts performance of a perceptual task. Proc Natl Acad Sci USA. 2012;109:3516–3521. - PMC - PubMed
    1. Bartels A, Zeki S. Brain dynamics during natural viewing conditions—a new guide for mapping connectivity in vivo. Neuroimage. 2005;24:339–349. - PubMed
    1. Berger H. On the electroencephalogram in man. Arch Psychiatr Nervenkr. 1929;87:527–543.

Publication types

MeSH terms