. 2013 Aug 12;26(3):279-91.
doi: 10.1016/j.devcel.2013.06.019. Epub 2013 Jul 25.

Advances in analysis of low signal-to-noise images link dynamin and AP2 to the functions of an endocytic checkpoint

Affiliations

Advances in analysis of low signal-to-noise images link dynamin and AP2 to the functions of an endocytic checkpoint

François Aguet et al. Dev Cell. .

Abstract

Numerous endocytic accessory proteins (EAPs) mediate assembly and maturation of clathrin-coated pits (CCPs) into cargo-containing vesicles. Analysis of EAP function through bulk measurement of cargo uptake has been hampered due to potential redundancy among EAPs and, as we show here, the plasticity and resilience of clathrin-mediated endocytosis (CME). Instead, EAP function is best studied by uncovering the correlation between variations in EAP association to individual CCPs and the resulting variations in maturation. However, most EAPs bind to CCPs in low numbers, making the measurement of EAP association via fused fluorescent reporters highly susceptible to detection errors. Here, we present a framework for unbiased measurement of EAP recruitment to CCPs and their direct effects on CCP dynamics. We identify dynamin and the EAP-binding α-adaptin appendage domain of the AP2 adaptor as switches in a regulated, multistep maturation process and provide direct evidence for a molecular checkpoint in CME.


Figures

Figure 1
Figure 1. Model-Based Detection of CCSs
(A) Detection of CCSs in BSC1 cells over-expressing EGFP-CLCa (EGFP-CLCa O/X, top row) or expressing genome-edited, endogenous CLCa-RFP (enCLCa-RFP, bottom row), imaged by TIRFM. Red patches indicate pixels detected as significant by a wavelet-based detection (Loerke et al., 2009); green circles indicate positions of CCSs detected with the model-based algorithm proposed here (see Supplemental Experimental Procedures). False-positives (FP) and false-negatives (FN) of the wavelet-based detection are in reference to the model-based detections. Scale bars: 5 urn, first column, and 2 µm, magnified insets. (B) Representative intensity traces of CCSs identified by model-based detection and tracking of EGFP-CLCa O/X and enCLCa-RFP. Gaps are defined as frames missed by the detection but recovered during tracking. Uncertainties for the detected intensities (shown as SD, dark shaded band) and the significance threshold (∼2 SD above background noise, light shaded area) were estimated using the residuals from the model fit to the raw image signal (see Supplemental Experimental Procedures). Residual signals in the dark shaded regions preceding and following the first and last detected CCS signals, respectively, were measured to verify detection of independent events (see Supplemental Experimental Procedures). Shown below are individual frames of each trace. See also Figures S1 and S2 and Movies S1 and S2.
Figure 2
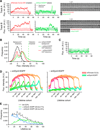
Figure 2. Intensity-Based Thresholding of Trajectories to Identify Bona Fide CCPs
(A) Lifetime distribution of detected CCSs from ten cells overexpressing EGFP-CLCa (colored traces, individual cells; black trace, population average); ∼9,000 ± 3,000 CCSs per cell. (B) Result of the best exponential fit (red) to the average distribution (black; from A). Inset, cumulative distribution. Fifty percent of CCSs have a lifetime <20 s. (C) Colored traces (top) show cumulative distributions of maximum fluorescence intensity over the lifetime of a CCS in individual cells; black trace, median distribution. After linear scaling (bottom; see Supplemental Experimental Procedures), the distributions narrowly overlay, indicating that the CCS maximum intensity distribution is invariant across cells. Inset, distribution of the scaling factors (mean ± SD, 0.99 ± 0.13). (D) CCS fluorescence (Fluo.) intensity versus time for different lifetime cohorts. Distributions were calculated from CCSs of ten cells and normalized for each of the ten first time points in the life of a CCS. The median intensity (lower panel) is lifetime invariant during the first ∼6 s of assembly. a.u., arbitrary units. (E) Maximum intensity distributions from scaled CCS intensity traces for different lifetime cohorts. Gray histograms indicate distribution of maximum intensities reached during the first 6 s of a CCS trace. Blue histograms indicate distribution of maximum intensities reached over the full lifetime of a CCS trace. Overlaid red curves indicate best fitting Gaussian distributions to the first mode of the 6 s histograms; dashed lines indicate the 95th percentile of these distributions, which served as a threshold to classify CCSs into transient assemblies (maximum intensity remains below threshold) or bona fide CCPs undergoing maturation (maximum intensity surpasses threshold). (F) Average lifetime distribution for bona fide CCPs and transient assemblies (CSs) resulting from application of the threshold.
Figure 3
Figure 3. Exclusion of Short-Lived, Instantaneously Appearing CCSs
(A) Averaged CCS intensity traces per lifetime cohort, shown as mean ± SE (shaded areas) for all above-threshold CCSs. Inset, enlarged scale showing aberrant rapid rise in intensity of shortlived (<20 s) CCSs (arrowhead). (B) Examples of intensity traces (green) with instantaneous appearance at an acquisition rate of 1 frame s−1. The majority lasts for less than 10 s, and intensity prior to the first detected frame is at background level, in contrast to CCPs of equally short lifetime (blue). (C) Subtraction of subthreshold (light green) and transient (light blue) CCSs from all detected CCSs (gray) yields an average lifetime distribution for bona fide CCPs that reflects a multistep maturation process. See also Figure S3.
Figure 4
Figure 4. SNR Achieved with Endogenous Levels of Fluorescently Labeled CLCa Is Insufficient for Accurate Lifetime Measurements
(A) Average lifetime distributions of CCPs for cells overexpressing EGFP-CLCa (green, same data as in Figure 3) and for genome-edited enCLCa-RFP cells (red, average of nine cells). Inset, distribution of SNR for all CCP detections in enCLCa-RFP and EGFP-CLCa O/X cells. (B) Simulation demonstrating the effects on lifetime distribution of missed detections (gaps) or insufficient gap closing during tracking. Red curve indicates reference gamma distribution fitted to EGFP-CLCa O/X lifetimes in (A) (rate parameter k = 0.05 s−1; shape parameter n = 2.3). Introduction of a single gap with uniform probability, or gap(s) based on the probability of occurrence derived from the EGFP-CLCa O/X data (inset), produces a quasi-exponential lifetime distribution (black and blue lines, respectively, simulated from 106 trajectories). (C) Master/slave detection of CCSs in genome-edited enCLCa-RFP cells overexpressing µ2-EGFP. Detection was performed on the µ2-EGFP “master” channel (first column); fluorescence intensities in the enCLCa-RFP “slave” channel were estimated by subpixel localization at the detected µ2-EGFP positions (second column; see Supplemental Experimental Procedures). Scale bar, 2 µm. (D) Lifetime distributions of CCPs measured independently using either the µ2-EGFP or the enCLCa-RFP channel. The enCLCa-RFP distribution was calculated from enCLCa-RFP trajectories with an associated µ2-EGFP signal and vice versa (see Supplemental Experimental Procedures). (E) Mean CCP lifetimes in EGFP-LCa O/X cells (black) and in enCLCa-RFP cells using the over-expressed µ2-EGFP marker (green) or using enCLCa-RFP (orange). Error bars: cell-to-cell variation, shown as SD from nine cells or more per condition. (F) Example intensity traces obtained by tracking either µ2-EGFP detections (analysis 1, shown with the associated enCLCa-RFP “slave” signal), or enCLCa-RFP detections (analysis 2). See also Movie S3.
Figure 5
Figure 5. Dynamin Is Recruited Early in CCP Formation and Is Required for CCP Maturation via a Multistep Process
(A) Representative intensity traces of dynamin recruitment early during CCP formation followed by a characteristic peak corresponding to assembly of the scission machinery, measured in SK-MEL-2 cells expressing endogenous Dyn2-EGFP (enDyn2-EGFP) and overexpressing tdTomato-CLCa. Fluo. int., fluorescence intensity. (B) Distribution of all enDyn2-EGFP slave detections from CCPs with detectable enDyn2-EGFP fluorescence (green) and from CCPs without detectable enDyn2-EGFP (red), compared to the distribution of enDyn2-EGFP outside CCP locations (black; see Supplemental Experimental Procedures). The 95th percentile of the background distribution was selected as a threshold to identify significant enDyn2-EGFP fluorescence [black line in (A)] (see Supplemental Experimental Procedures). A CCP was Dyn2-positive when the number of time points with independently detectable enDyn2-EGFP was significantly above the expected number of such detections due to random association in a trace of equal duration (see Supplemental Experimental Procedures). (C) Representative trace of enDyn2-EGFP intensity at a random location outside CCSs. (D) Average clathrin (red tones) and dynamin (green tones) fluorescence intensity traces in lifetime cohorts of Dyn2-positive and Dyn2-negative CCPs (see Supplemental Experimental Procedures). Intensities are shown as mean ± SE calculated from eight cells. (E) Lifetime distributions of bona fide CCPs identified as described in Figures 2 and 3 and further subcategorized as Dyn2-positive (green) or Dyn2-negative (blue). Characterization of enDyn2-EGFP recruitment relative to CCP disappearance and the full decomposition of lifetimes for CCPs and CSs categorized for enDyn2-EGFP recruitment are shown in Figure S4. See also Figure S4 and Movie S4.
Figure 6
Figure 6. The AP2 α-Adaptin Appendage Domain Is Dispensable for Transferrin Uptake and CCP Initiation
(A) Schematic of the AP2 heterotetramer, showing subunits and appendage domains. The α-adaptin appendage domain (AD) has two characterized binding sites for peptide motifs present in a majority of EAPs (Praefcke et al., 2004). (B) Immunoblots of AP-2 subunit expression. FL α-adaptin or C-terminally truncated α-adaptin lacking the appendage domain (ΔAD), each harboring siRNA-resistant mutations and bearing a brain-specific insert for detection, were stably expressed in EGFP-CLCa RPE cells. Cells expressing near-endogenous levels of each protein were selected by fluorescence-activated cell sorting, using an internal ribosome entry segment-expressed blue fluorescent protein (BFP). Cells expressing only BFP represent the control condition. The selected cells were subjected to α-adaptin siRNA to silence the endogenous protein. (C) Tfn uptake for the conditions indicated, shown as mean ± SD of six independent experiments. (D) EGFP-CLCa-labeled CCSs detected in fixed cells treated as indicated and imaged by TIRFM. All conditions are shown at the same dynamic range, normalized to [0…1], except for the contrast-adjusted α-adaptin siRNA comparison (rightmost panel). Scale bar. 5 µm. (E) Initiation density of all detected CCSs and bona fide CCPs with lifetime ≥5 s, for the conditions indicated (≥16 cells per condition). Box plots show median, 25th, and 75th percentiles, and outermost data points. ***p < 10−10, permutation test.
Figure 7
Figure 7. The AP2 α-Adaptin Appendage Domain Regulates Growth, Curvature Induction, and Maturation of Nascent CCPs
(A) Average lifetime distribution of all detected CCSs in EGFP-CLCa RPE cells for α-adaptin siRNA and re-expression conditions as indicated. (B) Average lifetime distributions of bona fide CCPs for α-adaptin siRNA and re-expression conditions as indicated. (C) EMs of “unroofed” RPE cells expressing an siRNA-resistant FL α-adaptin or ΔAD α-adaptin construct after siRNA-mediated depletion of endogenous α-adaptin. Right panel shows higher magnification view of the indicated area. Scale bar, 500 nm; 200 nm for the magnified view. (D) Epi:TIR ratio intensity levels for individual CCPs plotted as a function of CCP lifetime. (E) Lifetime distributions of relatively flat (Epi:TIR ratio <1.5) and relatively curved (Epi:TIR ratio >1.5) CCPs in FL α-adaptin-expressing cells (control) and ΔAD α-adaptin-expressing cells. (F) TfnR internalization in cells expressing FL α-adaptin or ΔAD α-adaptin in the presence and absence of Latrunculin A (100 nM), shown as mean ± SD of four independent experiments. (G) Percentages of persistent CCPs, which are not included in our lifetime analysis, are not significantly different in FL α-adaptin-expressing cells versus ΔAD α-adaptin-expressing cells. Box plots show median, 25th, and 75th percentiles, and outermost data points. n.s., not significant. p > 0.5, permutation test.

References

    1. Antonescu CN, Aguet F, Danuser G, Schmid SL. Phosphatidylinositol-(4,5)-bisphosphate regulates clathrin-coated pit initiation, stabilization, and size. Mol. Biol. Cell. 2011;22:2588–2600. - PMC - PubMed
    1. Cheezum MK, Walker WF, Guilford WH. Quantitative comparison of algorithms for tracking single fluorescent particles. Biophys. J. 2001;81:2378–2388. - PMC - PubMed
    1. Cocucci E, Aguet F, Boulant S, Kirchhausen T. The first five seconds in the life of a clathrin-coated pit. Cell. 2012;150:495–507. - PMC - PubMed
    1. Conner SD, Schmid SL. Regulated portals of entry into the cell. Nature. 2003;422:37–44. - PubMed
    1. Damke H, Binns DD, Ueda H, Schmid SL, Baba T. Dynamin GTPase domain mutants block endocytic vesicle formation at morphologically distinct stages. Mol. Biol. Cell. 2001;12:2578–2589. - PMC - PubMed

Publication types

MeSH terms