

Ethanol alters gene expression and cell organization during optic vesicle evagination
- PMID: 23892006
- PMCID: PMC3988994
- DOI: 10.1016/j.neuroscience.2013.07.036
Ethanol alters gene expression and cell organization during optic vesicle evagination
Abstract
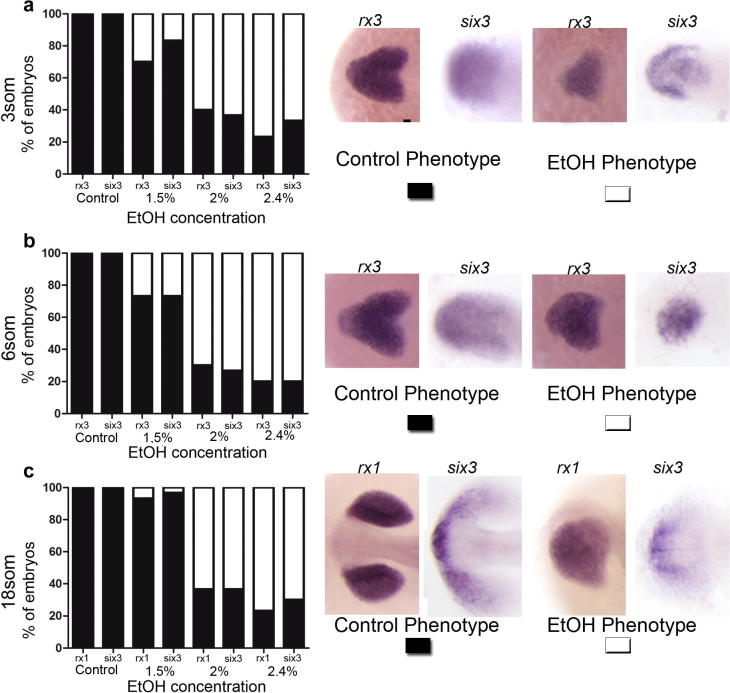
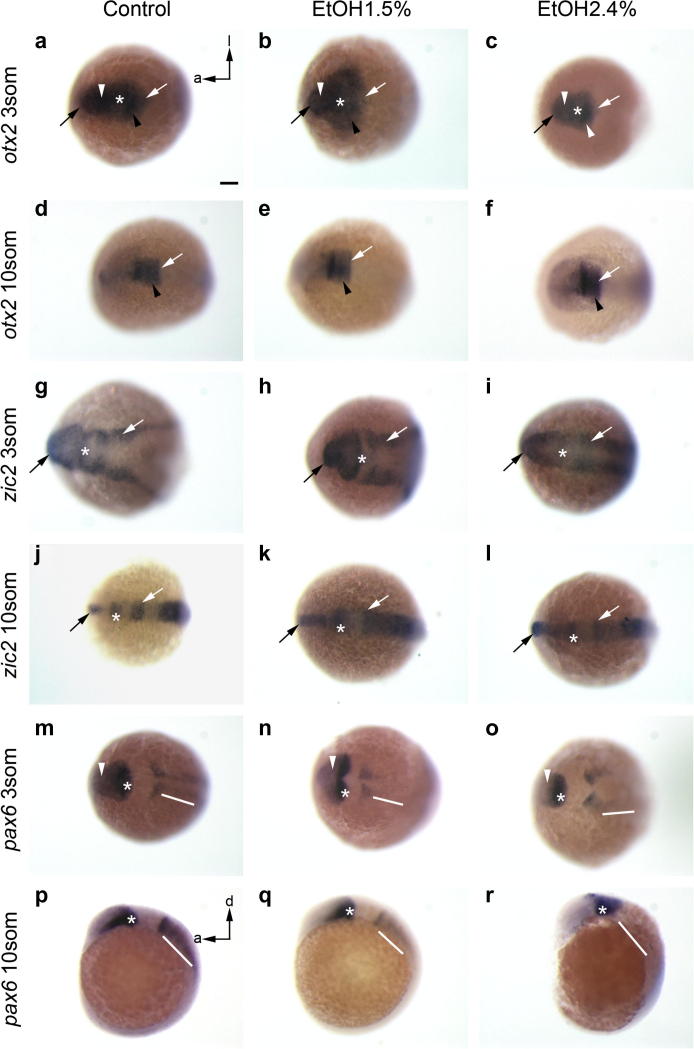
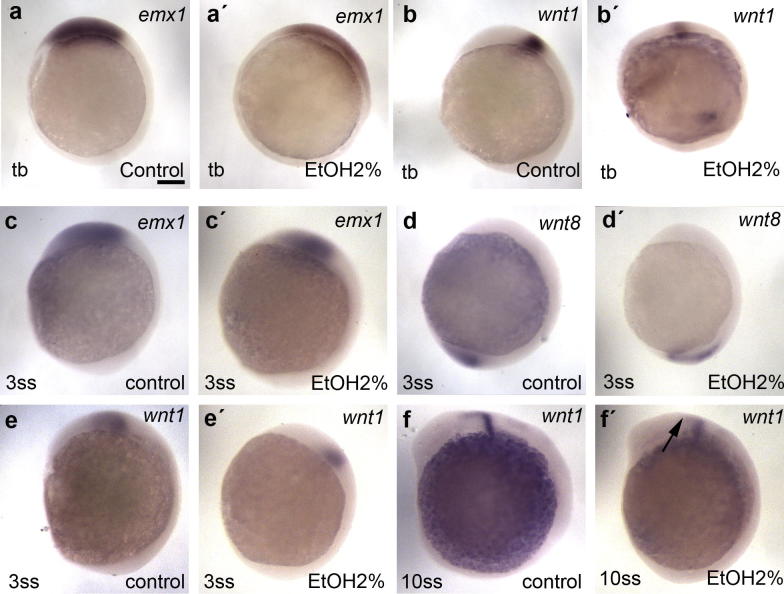
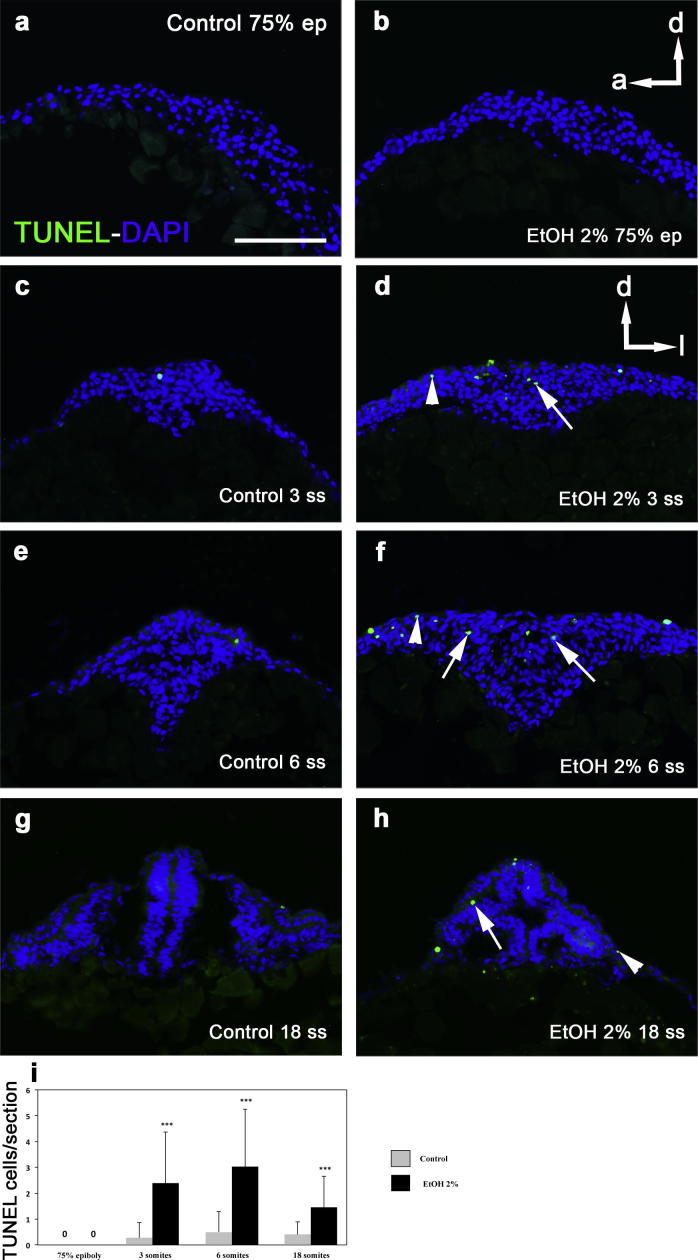
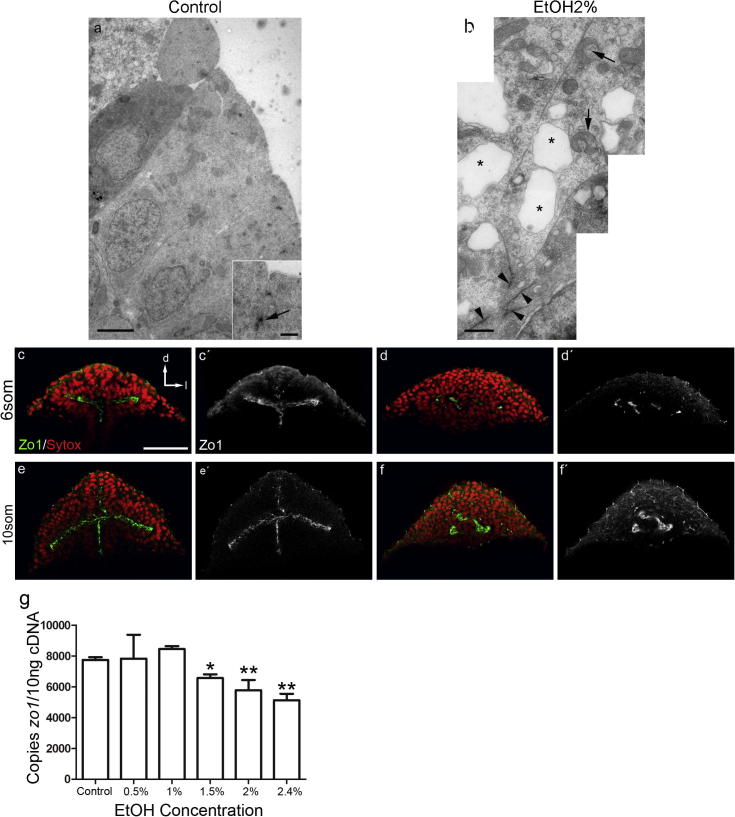
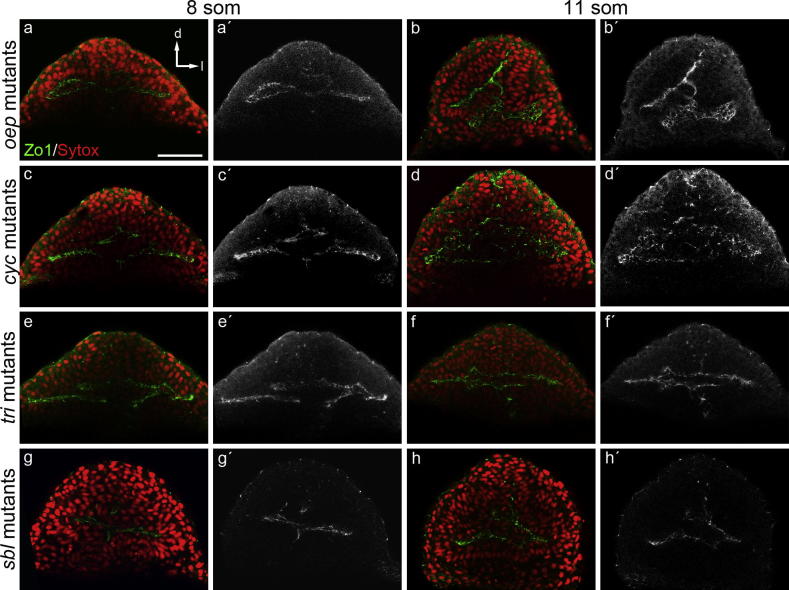
Ethanol has been described as a teratogen in vertebrate development. During early stages of brain formation, ethanol affects the evagination of the optic vesicles, resulting in synophthalmia or cyclopia, phenotypes where the optic vesicles partially or totally fuse. The mechanisms by which ethanol affects the morphogenesis of the optic vesicles are however largely unknown. In this study we make use of in situ hybridization, electron microscopy and immunohistochemistry to show that ethanol has profound effects on cell organization and gene expression during the evagination of the optic vesicles. Exposure to ethanol during early eye development alters the expression patterns of some genes known to be important for eye morphogenesis, such as rx3/1 and six3a. Furthermore, exposure to ethanol interferes with the acquisition of neuroepithelial features by the eye field cells, which is clear at ultrastructual level. Indeed, ethanol disrupts the acquisition of fusiform cellular shapes within the eye field. In addition, tight junctions do not form and retinal progenitors do not properly polarize, as suggested by the mis-localization and down-regulation of zo1. We also show that the ethanol-induced cyclopic phenotype is significantly different to that observed in cyclopic mutants, suggesting a complex effect of ethanol on a variety of targets. Our results show that ethanol not only disrupts the expression pattern of genes involved in retinal morphogenesis, such as rx3 and rx1, but also disrupts the changes in cell polarity that normally occur during eye field splitting. Thus, ethylic teratology seems to be related not only to modifications in gene expression and cell death but also to alterations in cell morphology.
Keywords: ISH; MET; MHB; SEM; TUNEL; ZO-1; cell polarity; cyclopic mutants; eye specification; hours post-fertilization; hpf; in situ hybridization; mesenchymal–epithelial transition; midbrain–hindbrain boundary; morphogenesis; oep; one-eye pinhead; qRT-PCR; quantitative real-time polymerase chain reaction; somites stage; ss; standard error of mean; terminal deoxynucleotidyl transferase dUTP nick end labeling; zonula-occludens-1.
Copyright © 2013 IBRO. Published by Elsevier Ltd. All rights reserved.
Figures

Similar articles
-
Cytoarchitectonic and neurochemical differentiation of the visual system in ethanol-induced cyclopic zebrafish larvae.Neurotoxicol Teratol. 2011 Nov-Dec;33(6):686-97. doi: 10.1016/j.ntt.2011.06.001. Epub 2011 Jun 12. Neurotoxicol Teratol. 2011. PMID: 21684331
-
Zebrafish rx3 and mab21l2 are required during eye morphogenesis.Dev Biol. 2004 Jun 15;270(2):336-49. doi: 10.1016/j.ydbio.2004.02.026. Dev Biol. 2004. PMID: 15183718
-
Precocious acquisition of neuroepithelial character in the eye field underlies the onset of eye morphogenesis.Dev Cell. 2013 Nov 11;27(3):293-305. doi: 10.1016/j.devcel.2013.09.023. Epub 2013 Oct 24. Dev Cell. 2013. PMID: 24209576 Free PMC article.
-
An enigmatic translocation of the vertebrate primordial eye field.BMC Evol Biol. 2020 Oct 2;20(1):129. doi: 10.1186/s12862-020-01693-6. BMC Evol Biol. 2020. PMID: 33008334 Free PMC article. Review.
-
Pax genes in development and maturation of the vertebrate visual system: implications for optic nerve regeneration.Histol Histopathol. 2001 Jan;16(1):239-49. doi: 10.14670/HH-16.239. Histol Histopathol. 2001. PMID: 11193200 Review.
Cited by
-
Kinesin-1 promotes chondrocyte maintenance during skeletal morphogenesis.PLoS Genet. 2017 Jul 17;13(7):e1006918. doi: 10.1371/journal.pgen.1006918. eCollection 2017 Jul. PLoS Genet. 2017. PMID: 28715414 Free PMC article.
-
Exposure to ethanol leads to midfacial hypoplasia in a zebrafish model of FASD via indirect interactions with the Shh pathway.BMC Biol. 2021 Jul 1;19(1):134. doi: 10.1186/s12915-021-01062-9. BMC Biol. 2021. PMID: 34210294 Free PMC article.
-
Alternative splicing of jnk1a in zebrafish determines first heart field ventricular cardiomyocyte numbers through modulation of hand2 expression.PLoS Genet. 2020 May 18;16(5):e1008782. doi: 10.1371/journal.pgen.1008782. eCollection 2020 May. PLoS Genet. 2020. PMID: 32421721 Free PMC article.
-
Human Retinal Organoids Provide a Suitable Tool for Toxicological Investigations: A Comprehensive Validation Using Drugs and Compounds Affecting the Retina.Stem Cells Transl Med. 2022 Mar 17;11(2):159-177. doi: 10.1093/stcltm/szab010. Stem Cells Transl Med. 2022. PMID: 35298655 Free PMC article.
-
An Overview towards Zebrafish Larvae as a Model for Ocular Diseases.Int J Mol Sci. 2023 Mar 11;24(6):5387. doi: 10.3390/ijms24065387. Int J Mol Sci. 2023. PMID: 36982479 Free PMC article. Review.
References
-
- Andreazzoli M., Gestri G., Angeloni D., Menna E., Barsacchi G. Role of Xrx1 in xenopus eye and anterior brain development. Development. 1999;126(11):2451–2460. (epub 1999/05/05) - PubMed
-
- Arenzana F.J., Carvan M.J., 3rd, Aijón J., Sánchez-González R., Arévalo R., Porteros A. Teratogenic effects of ethanol exposure on zebrafish visual system development. Neurotoxicol Teratol. 2006;28(3):342–348. (Epub 2006/04/01) - PubMed
-
- Bailey T.J., El-Hodiri H., Zhang L., Shah R., Mathers P.H., Jamrich M. Regulation of vertebrate eye development by Rx genes. Int J Dev Biol. 2004;48(8–9):761–770. (Epub 2004/11/24) - PubMed
-
- Bannigan J., Burke P. Ethanol teratogenicity in mice: a light microscopic study. Teratology. 1982;26(3):247–254. (Epub 1982/12/01) - PubMed
-
- Barrios A., Poole R.J., Durbin L., Brennan C., Holder N., Wilson S.W. Eph/Ephrin signaling regulates the mesenchymal-to-epithelial transition of the paraxial mesoderm during somite morphogenesis. Curr Biol. 2003;13(18):1571–1582. (Epub 2003/09/19) - PubMed
Publication types
MeSH terms
Substances
LinkOut - more resources
Full Text Sources
Other Literature Sources
Medical
Miscellaneous
