. 2013:4:2203.
doi: 10.1038/ncomms3203.

Measurement of acetylation turnover at distinct lysines in human histones identifies long-lived acetylation sites

Affiliations

Measurement of acetylation turnover at distinct lysines in human histones identifies long-lived acetylation sites

Yupeng Zheng et al. Nat Commun. 2013.

Abstract

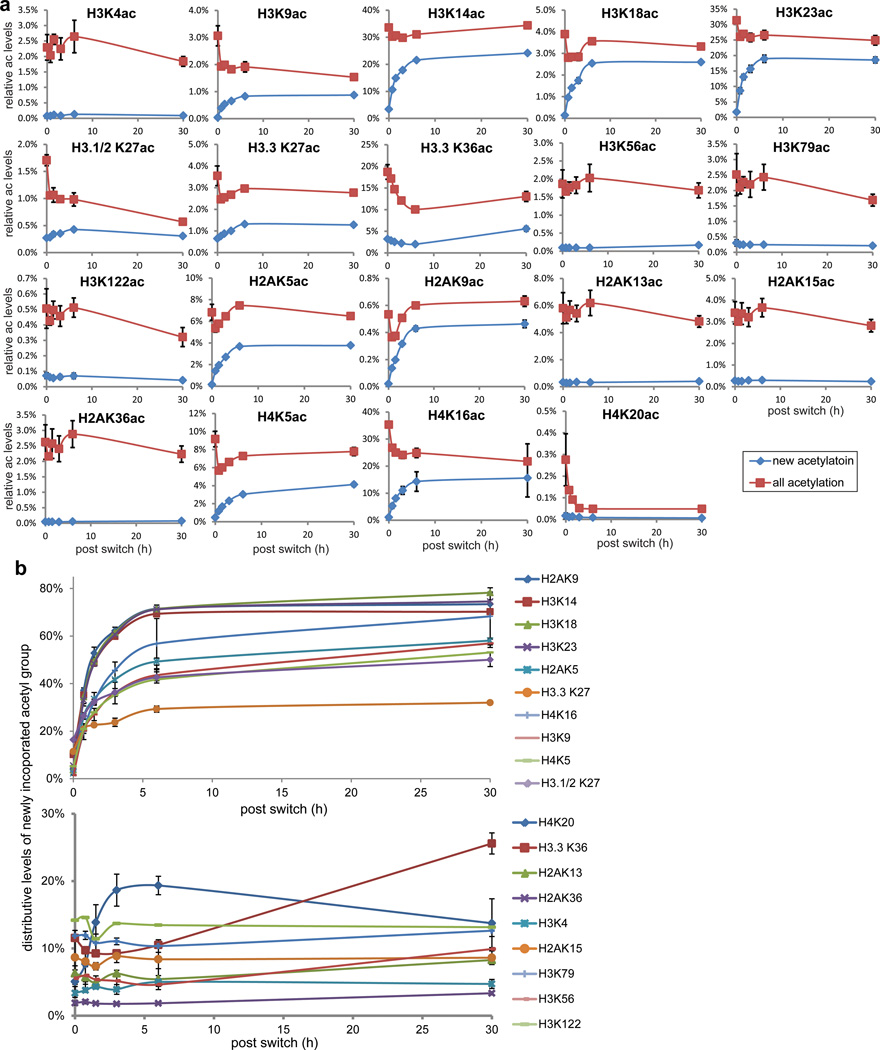
Histone acetylation has long been determined as a highly dynamic modification associated with open chromatin and transcriptional activation. Here we develop a metabolic labelling scheme using stable isotopes to study the kinetics of acetylation turnover at 19 distinct lysines on histones H3, H4 and H2A. Using human HeLa S3 cells, the analysis reveals 12 sites of histone acetylation with fast turnover and 7 sites stable over a 30 h experiment. The sites showing fast turnover (anticipated from classical radioactive measurements of whole histones) have half-lives between ~1-2 h. To support this finding, we use a broad-spectrum deacetylase inhibitor to verify that only fast turnover sites display 2-10-fold increases in acetylation whereas long-lived sites clearly do not. Most of these stable sites lack extensive functional studies or localization within global chromatin, and their role in non-genetic mechanisms of inheritance is as yet unknown.


Figures

Figure 1
Figure 1. Schematic of experimental workflow for the measurement of histone acetylation turnover
(a) The approach involves two steps of stable isotope labeling to detect old versus new acetylation events specifically on old histones. The workflow begins with exhaustive labeling of cells in heavy arginine media to label the histone backbone (depicted as a dark oval), followed by media exchange to label newly installed acetyl groups in lysine residues. Time points are taken and the material subjected to quantitative MS analysis of histone peptides. Detection of old acetylation corresponding to a light acetyl group (depicted as a light triangle) and new acetylation with a heavy acetyl group (depicted as dark triangle) is followed by fitting the data to an exponential model to calculate acetylation turnover rate for each site. (b) Stable isotope labeled glucose (or sodium pyruvate) was converted to labeled acetyl-CoA by primary metabolism.
Figure 2
Figure 2. Appearance of new acetylation on histone peptides detected by quantitative mass spectrometry
Shown on the y-axes are the raw intensity values determined from the mass spectrometric data. The temporal profile for signals corresponding to old (blue) vs. new (red) acetylation on the H3K9un-K14ac (a) and H3K4ac (b) peptides exhibiting fast and no turnover, respectively. Both old and new acetylation were quantified using total area from 3 pairs of transitions (i.e., precursor → fragment).
Figure 3
Figure 3. Appearance of new acetyl group in 19 acetylated lysines using 13C6 – glucose as a tracer
(a) Relative levels of both new acetylation (occurred after the media switch; blue diamonds) and all acetylation (both old and new; red squares) in 19 acetylated sites. These levels were determined by normalizing against overall signal from all measured modfied species (see Methods). (b) Distributive levels of new acetylation for 19 acetylated sites were determined by divding the peak area of new acetylation by that of total acetylation present at each particular site. The ten fast sites reaching a steady plateau are shown in upper panel, while the sites with no detectable new acetylation are displayed in the lower panel. Data from two biological replicates with three technical replicates of each were reported with SEMs shown as error bars.
Figure 4
Figure 4. Correlaton analyses of acetylation half-lives
(a) Half-lives of acetylation sites with fast turnover correlated with their response to treatment with sodium butyrate. (b) Correlation of T1/2 values with the absolute stoichiometry of acetylation for each site. Note that half-lives for sites with undetectable turnover were all set to >30 hour (x-axis, lower right). Both vertical and horizontal error bars indicate the standard deviation from their respective analyses.
Figure 5
Figure 5. Summary of acetylation turnover rates at 19 distinct lysine residues within core histones
Illustrations showing known lysine acetylation sites in four core histones as ‘K’ followed by amino acid residue number. The globular domains are marked by grey bars. Fast turnover sites are overlaid with green and blue arrows for Group I and II sites, respectively. Stable sites (Group III) are indicated by red stop signs. Sites not measured in this study are labeled as ND.

References

    1. Luger K, Dechassa ML, Tremethick DJ. New insights into nucleosome and chromatin structure: an ordered state or a disordered affair? Nat Rev Mol Cell Biol. 2012;13:436–447. - PMC - PubMed
    1. Clapier CR, Cairns BR. The biology of chromatin remodeling complexes. Annual review of biochemistry. 2009;78:273–304. - PubMed
    1. Suganuma T, Workman JL. Signals and combinatorial functions of histone modifications. Annual review of biochemistry. 2011;80:473–499. - PubMed
    1. Isenberg I. Histones. Annual review of biochemistry. 1979;48:159–191. - PubMed
    1. Shahbazian MD, Grunstein M. Functions of site-specific histone acetylation and deacetylation. Annual review of biochemistry. 2007;76:75–100. - PubMed

Publication types

LinkOut - more resources