. 2013 Oct;41(18):8637-53.
doi: 10.1093/nar/gkt657. Epub 2013 Jul 26.

Transactivation specificity is conserved among p53 family proteins and depends on a response element sequence code

Affiliations

Transactivation specificity is conserved among p53 family proteins and depends on a response element sequence code

Yari Ciribilli et al. Nucleic Acids Res. 2013 Oct.

Abstract

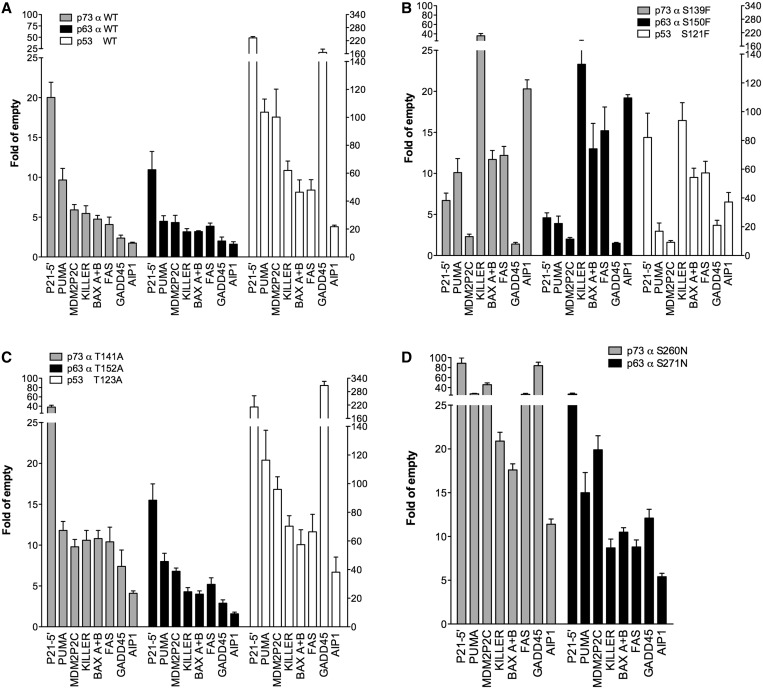
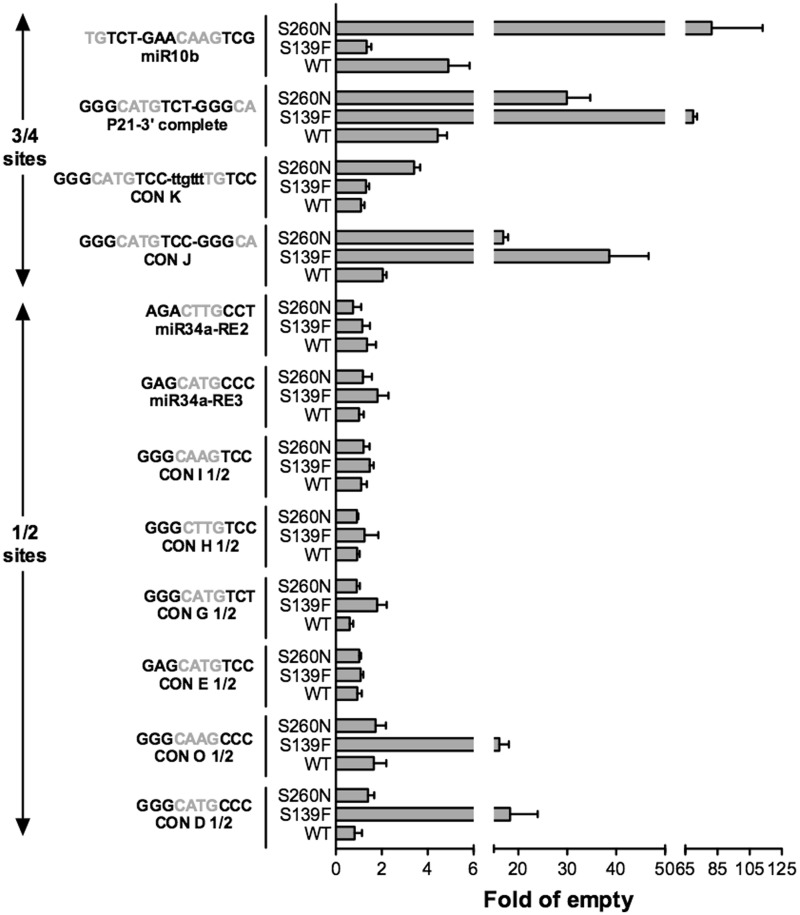
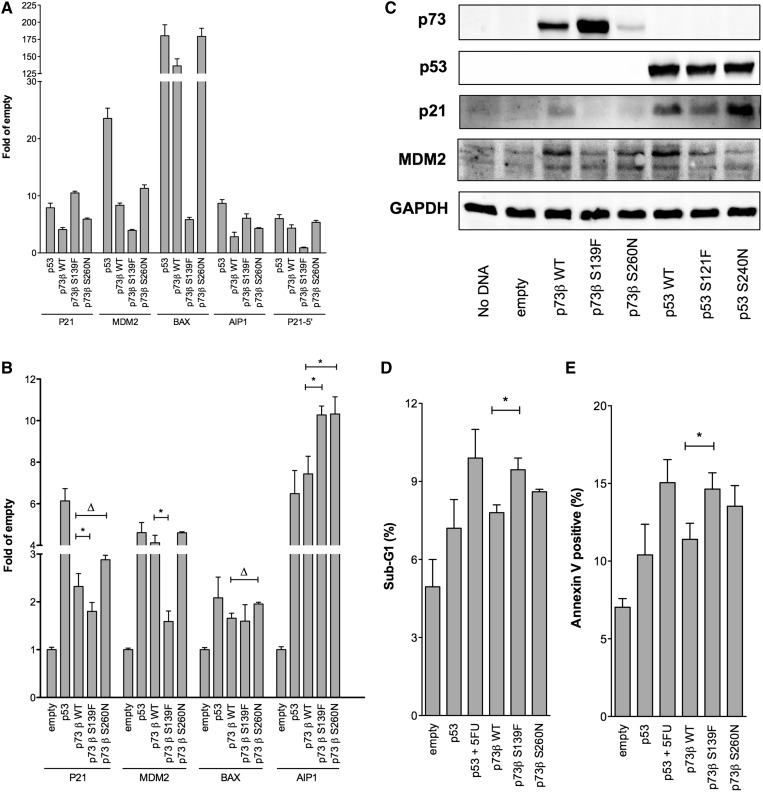
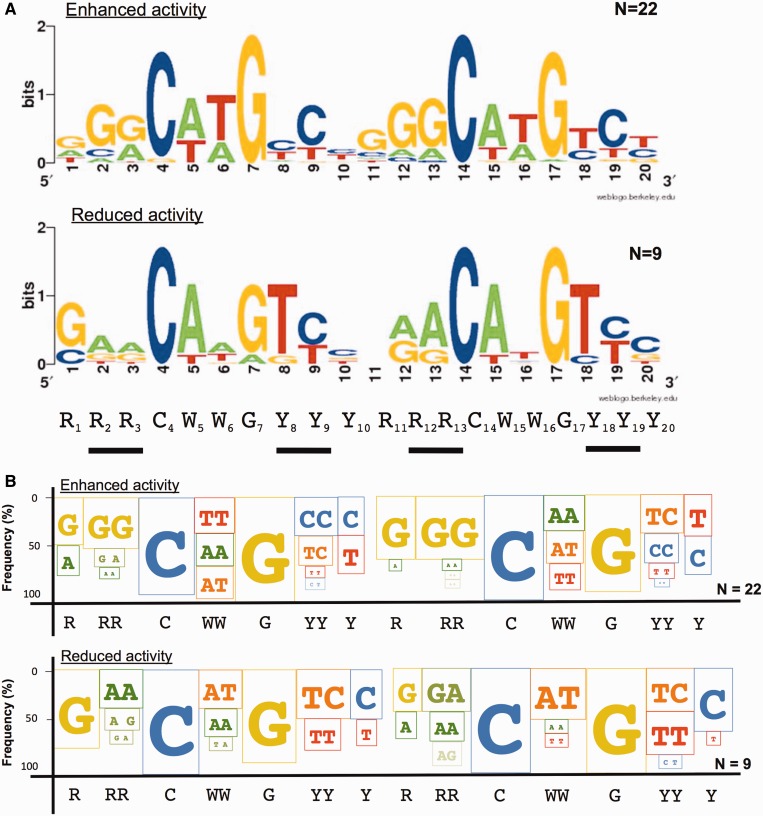
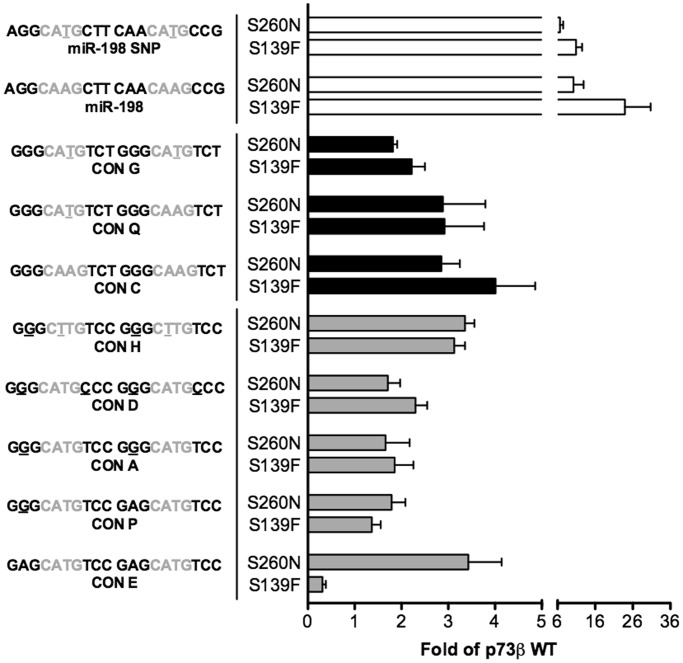
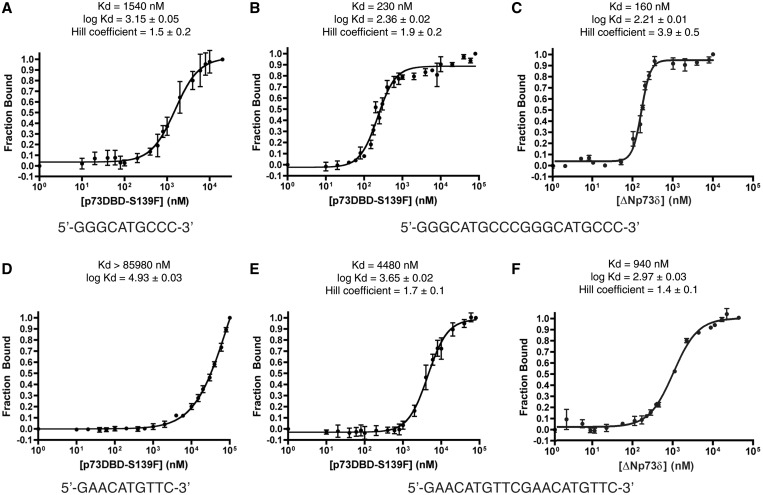
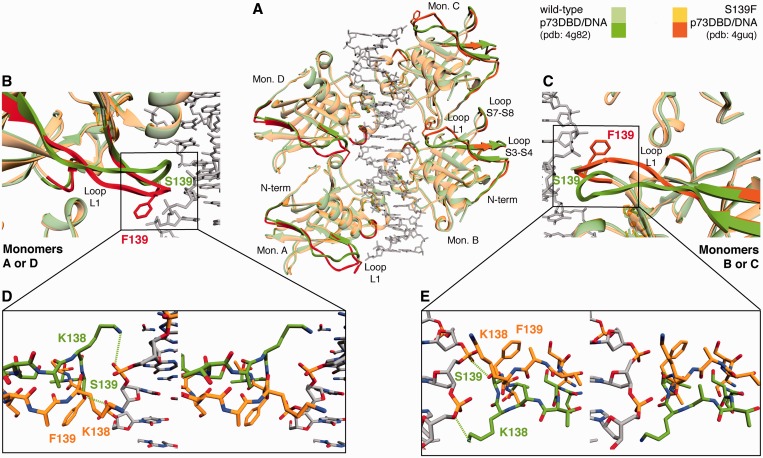
Structural and biochemical studies have demonstrated that p73, p63 and p53 recognize DNA with identical amino acids and similar binding affinity. Here, measuring transactivation activity for a large number of response elements (REs) in yeast and human cell lines, we show that p53 family proteins also have overlapping transactivation profiles. We identified mutations at conserved amino acids of loops L1 and L3 in the DNA-binding domain that tune the transactivation potential nearly equally in p73, p63 and p53. For example, the mutant S139F in p73 has higher transactivation potential towards selected REs, enhanced DNA-binding cooperativity in vitro and a flexible loop L1 as seen in the crystal structure of the protein-DNA complex. By studying, how variations in the RE sequence affect transactivation specificity, we discovered a RE-transactivation code that predicts enhanced transactivation; this correlation is stronger for promoters of genes associated with apoptosis.


Figures

Figure 1.
Figure 1.
Evolutionarily conserved altered-function amino acid positions in p53 family proteins exhibit overlapping relative transactivation potentials. (A) Transactivation potential of WT p73, p63 and p53 expressed under the moderate constitutive ADH1 promoter towards eight REs was determined using a yeast-based functional assay. (B) Transactivation potential of the p73 S139F and the corresponding p63 S150F and p53 S121F mutants. (C) Transactivation potential of the p73 T141A, the corresponding p63 T152A and p53 T123A mutants. (D) Transactivation potential of the p73 S260N, the corresponding p63 S271N. Presented in all graph is the fold-induction over the empty expression vector (pRS314) of mean luciferase activities normalized to unit of soluble proteins. Error bars plot the standard deviations of four biological replicates. The Y-axis on the left refers to the results with p53 alleles. The higher relative activity of p53 proteins is discussed in the text. The RE sequences are ordered based on decreasing WT p73 transactivation potential. For p73 and p63, TA alpha isoform proteins were examined.
Figure 2.
Figure 2.
Altered function TA p73β mutants can activate transcription from non-canonical REs. Relative transactivation potentials of p73β alleles (WT, S139F and S260N) towards 12 non-canonical p53 REs comprising ¾- and ½-sites were determined using the yeast-based functional assay. The name and sequence of the 12 REs are shown. The core (GWWC) sequence is depicted in grey. Bars plot the mean fold of induction (normalized to OD600) over the empty expression vector (pRS314) and standard deviations of four biological replicates, computed as in Figure 1.
Figure 3.
Figure 3.
Altered transactivation and enhanced induction of apoptotic markers in p53 null HCT116 cells, on ectopic expression of p73 S139F or S260N. HCT116 p53−/− were transiently transfected with expression vectors for p53, p73β alleles or an empty pCMV Neo-Bam control vector. (A) Gene reporter assays were performed by co-transfecting luciferase reporter vectors containing portions of the promoter sequence of the indicated p53-target genes along with the pRL-SV40 vector as a control for transfection efficiency. Presented are mean relative inductions over the empty expression vector and the standard deviations of at least three biological replicates. (B) Endogenous P21, MDM2, BAX and AIP1 transcript measurements were obtained by RT-qPCR 24 h post-transfection with the indicated p53 family expression vectors. Bars represent mean fold of induction normalized to the reference genes β2-microglobulin and GAPDH; standard deviations of at least three biological repeats. Asterisk indicates that the results of a two-tailed equal variance t-test is at least P < 0.01 (from left to right P = 0.008, P = 0.0005, P = 0.009 and P = 0.008, respectively). For Δ, P-value is at least <0.05 (from left to right P = 0.031 and P = 0.047). (C) Ectopically expressed p73/p53 alleles as well as endogenous p21 and MDM2 protein levels were measured by western blot 24 h post-transfection. GAPDH was used as loading control. (D and E) Proportion of Sub-G1 or Annexin V positive cells. Presented are the means and the standard deviations of at least three biological replicates. 5-Fluorouracil treatment 8 h after transfection with the p53 expression vector was included as a positive control (*P = 0.009).
Figure 4.
Figure 4.
Dinucleotide signatures associated with enhanced or reduced transactivation potential by p73 S139F.p53 REs that were active with WT p73 were grouped according to enhanced (n = 22), reduced (n = 9) or nearly equal (n = 6) transactivation potential with p73 S139F (see Supplementary Table S1 for details on the cut-off of the WT/S139F ratios for the three classes). Dinucleotide sequences in the purine, pyrimidine and WW positions flanking the conserved C and G appeared to be correlated with the altered transactivation specificity. Therefore, instead of a conventional web-logo summary (A) (WebLogo 3, http://weblogo.berkeley.edu/logo.cgi), we developed a graphical summary that takes into account frequency of occurrences for paired nucleotide sequences (B). Plotted in this new version of the logo, where size is proportional to frequency, are only consensus changes. This graphical summary highlights how enhanced transactivation is associated with a lower frequency of CATG core sequence and with the GG, in RRC, and CC, in GYY, sequences. The p53 consensus sequence is indicated. As for the traditional logo view, spacers between half sites are omitted in the graphical summary.
Figure 5.
Figure 5.
Ad-hoc permutations of p53 REs confirms a role of specific sequence features in mediating altered transactivation specificity by p73 S139F. Starting from CON E, CON C or miR-198 REs, 1 or 2 nt changes (underlined) were introduced in the core (CWWG, depicted in grey) or the core-flanking R and Y positions. The relative transactivation compared with WT p73 was measured for p73 S139F and S260N. Presented are the means and standard deviations of four biological replicates of the luciferase activity (normalized to OD600) measured in the various yeast strains. Results are expressed as transactivation ratio of p73 S139F or S260N over WT p73β. The colours of the bars group the permutated REs to be compared.
Figure 6.
Figure 6.
DNA-binding constants of the p73 S139F DBD mutant and the ΔNp73δ isoform for GGGCA and GAACA sequences. (A) The plot shows the fraction of fluorescein-conjugated GGGCA ½-site RE bound versus the added concentration of pure p73DBD S139F mutant. The sigmoidal dose-response curve was fit with a Hill coefficient different than 1. The error bars indicate the standard deviation between three data sets. The Kd was the concentration of p73 S139F DBD where 50% of the DNA substrate was bound to the protein. (B) The same procedure was repeated with the GGGCA full-site RE, showing even tighter binding with a Kd ∼7-fold lower in value. (C) Same as (B), but for the ΔNp73δ isoform. (D) Same as (A), but with a GAACA ½-site RE. (E) Same as (B), but with a GAACA full-site RE. The GAACA REs have much lower binding affinity than their GGGCA counterparts. (F) Same as (E), but for the ΔNp73δ isoform. The p73 S139F mutant has similar DNA affinity and specificity that the ΔNp73δ isoform.
Figure 7.
Figure 7.
Crystal structure of the p73 S139F DBD mutant in complex with a full-site RE and in comparison with the WT p73 DBD structure. (A) The p73 S139F DBD tetramer (yellow–orange) in complex with a 20mer GAACA DNA (grey) superimposed to the p73 WT tetramer (green–dark green) confirms the C2 molecular symmetry observed in all the DBDs of the p53 family. The regions with a root means square difference greater than 1.5 are in darker colours (orange for the mutant F139 and dark green for the WT). Besides changes in loop L1 and the N-terminus of all monomers, monomers B and C show differences in loops S3-S4 and S7-S8 that are far from the DNA-binding surface. (B and C) Ribbon display of the comparison of the secondary structure of loop L1 between the p73 S139F DBD–DNA complex structure (orange) and the WT p73 DBD-DNA complex structure (dark green) for both monomers A or D (Figure 7B) and monomers B or C (Figure 7C). In both unique monomers, loop L1 moves away from the DNA. (D and E) Stereo view of the atomic display of the comparison of the secondary structure of loop L1 between the S139F p73 DBD–DNA complex structure (orange) and the WT p73 DBD–DNA complex structure (dark green) for both monomers A or D (Figure 7D) and monomers B or C (Figure 7E). In the WT p73DBD, S139 is at hydrogen bond distance (3.4 Å) of an oxygen atom in the DNA phosphate backbone. Instead, in the p73 S139F mutant DBD, the aromatic ring of the phenylalanine is rotated away from the DNA backbone and does not contact the DNA. Moreover, although in WT p73 the terminal amine of K138 is 3.8 Å from the oxygen in the phosphate backbone, in the S139F mutant, K138 is significantly displaced and cannot form the same interactions as in the WT. The p73 WT DBD–20mer complex structure is deposited in the PDB with ID: 4g82 (34), and the p73 S139F DBD–20mer complex structure is deposited in the PDB with ID: 4guq.

Similar articles

Cited by

References

    1. Lane DP, Crawford LV. T antigen is bound to a host protein in SV40-transformed cells. Nature. 1979;278:261–263. - PubMed
    1. Kaghad M, Bonnet H, Yang A, Creancier L, Biscan JC, Valent A, Minty A, Chalon P, Lelias JM, Dumont X, et al. Monoallelically expressed gene related to p53 at 1p36, a region frequently deleted in neuroblastoma and other human cancers. Cell. 1997;90:809–819. - PubMed
    1. Yang A, Kaghad M, Wang Y, Gillett E, Fleming MD, Dotsch V, Andrews NC, Caput D, McKeon F. p63, a p53 homolog at 3q27-29, encodes multiple products with transactivating, death-inducing, and dominant-negative activities. Mol. Cell. 1998;2:305–316. - PubMed
    1. Collavin L, Lunardi A, Del Sal G. p53-family proteins and their regulators: hubs and spokes in tumor suppression. Cell Death Differ. 2010;17:901–911. - PubMed
    1. Wei J, Zaika E, Zaika A. p53 Family: role of protein isoforms in human Cancer. J Nucleic Acids. 2012;2012:687359. - PMC - PubMed

Publication types

MeSH terms

Associated data