. 2013 Dec:42:256-68.
doi: 10.1016/j.reprotox.2013.07.017. Epub 2013 Jul 25.

Metabolic disruption in male mice due to fetal exposure to low but not high doses of bisphenol A (BPA): evidence for effects on body weight, food intake, adipocytes, leptin, adiponectin, insulin and glucose regulation

Affiliations

Metabolic disruption in male mice due to fetal exposure to low but not high doses of bisphenol A (BPA): evidence for effects on body weight, food intake, adipocytes, leptin, adiponectin, insulin and glucose regulation

Brittany M Angle et al. Reprod Toxicol. 2013 Dec.

Abstract

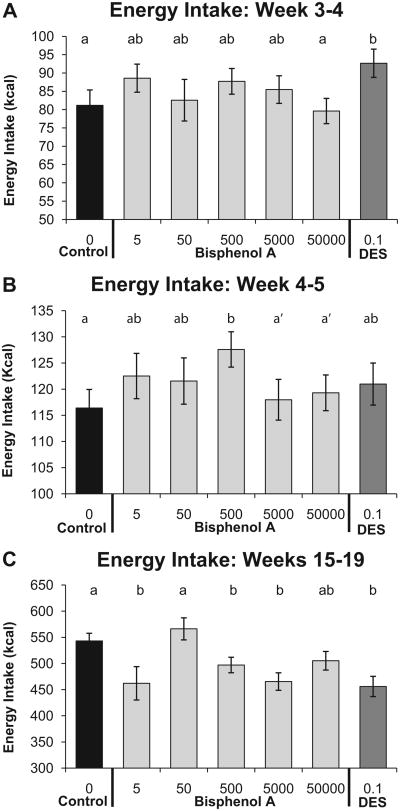
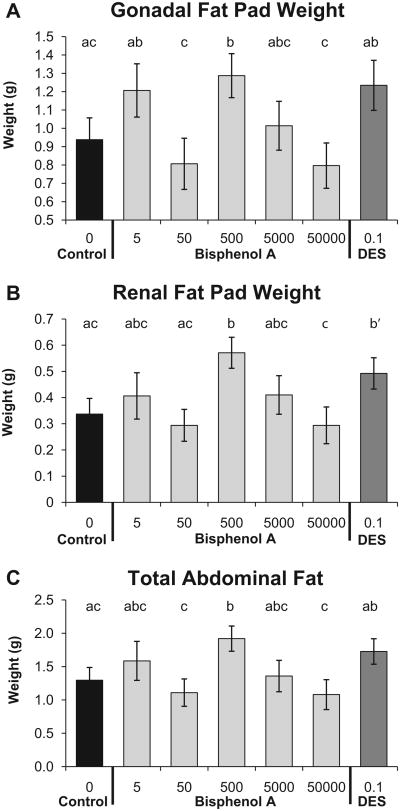
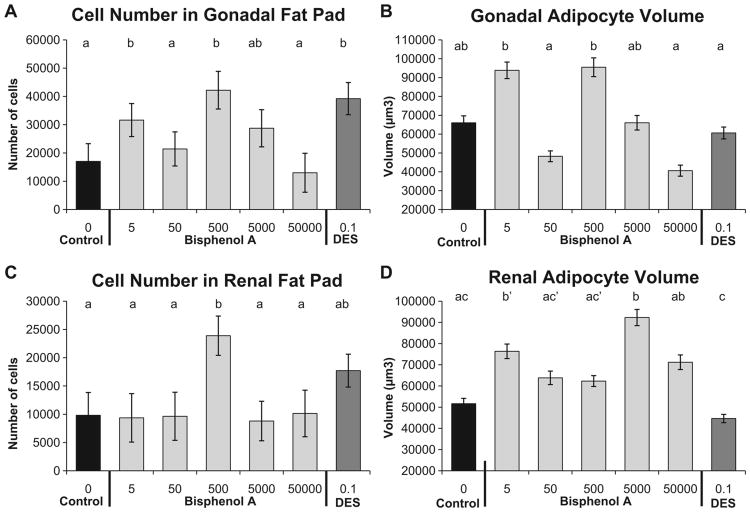
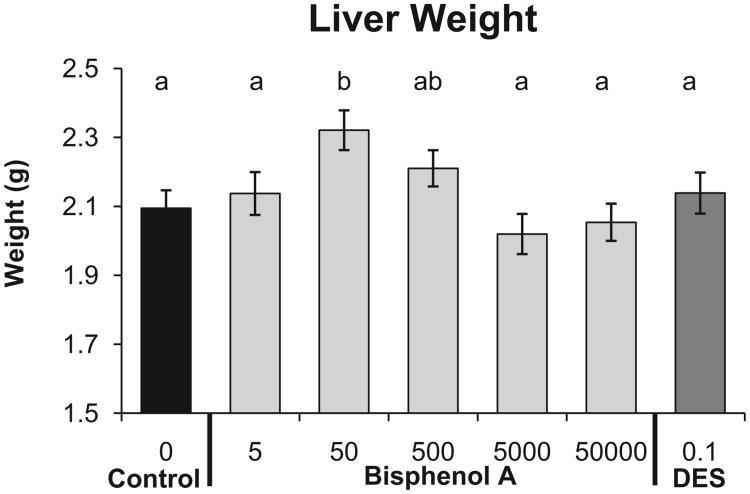
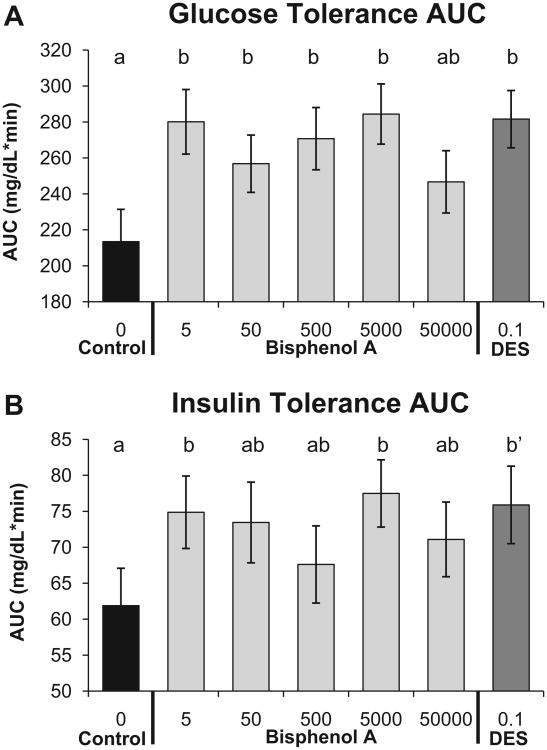
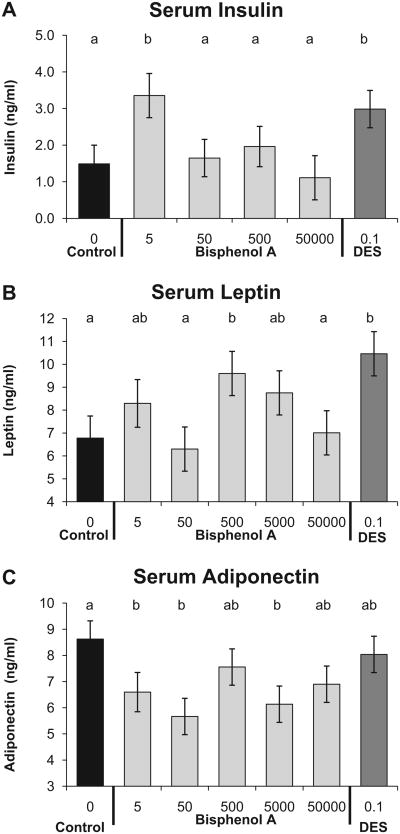
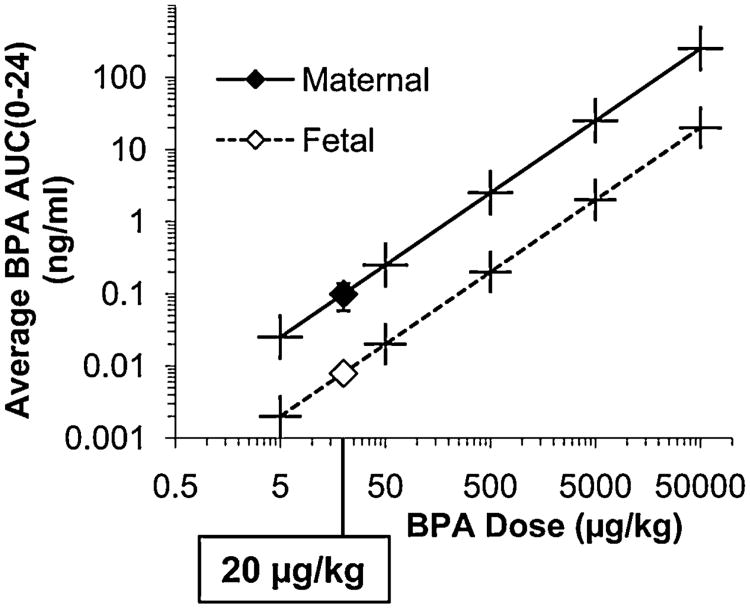
Exposure to bisphenol A (BPA) is implicated in many aspects of metabolic disease in humans and experimental animals. We fed pregnant CD-1 mice BPA at doses ranging from 5 to 50,000μg/kg/day, spanning 10-fold below the reference dose to 10-fold above the currently predicted no adverse effect level (NOAEL). At BPA doses below the NOAEL that resulted in average unconjugated BPA between 2 and 200pg/ml in fetal serum (AUC0-24h), we observed significant effects in adult male offspring: an age-related change in food intake, an increase in body weight and liver weight, abdominal adipocyte mass, number and volume, and in serum leptin and insulin, but a decrease in serum adiponectin and in glucose tolerance. For most of these outcomes non-monotonic dose-response relationships were observed; the highest BPA dose did not produce a significant effect for any outcome. A 0.1-μg/kg/day dose of DES resulted in some but not all low-dose BPA outcomes.

Keywords: Adipocytes; Endocrine disruption; Food intake; Glucose tolerance; Metabolic syndrome.


Figures

Fig. 1
Fig. 1
Effect of fetal BPA exposure on mean (±SEM) energy intake (in kcal) per week beginning after weaning (Panel A between weeks 3 and 4 and Panel B between week 4 and 5 of age) as well as during the last 4 weeks of the experiment (Panel C between weeks 15 and 19). Groups with different letters are significantly different from each other. Panel B: a′, P<0.1 vs. BPA-500.
Fig. 2
Fig. 2
Effect of fetal exposure to BPA on mean (±SEM) abdominal fat pad weight in males from different prenatal treatment groups when 19 weeks old. Panel A: gonadal fat pad weight; Panel B: renal fat pad weight; Panel C: total abdominal fat pad weight consisting of the sum of the gonadal and renal fat pad weights. Groups with different letters are significantly different from each other. Panel B: b′, P= 0.07 vs. controls.
Fig. 3
Fig. 3
Effect of fetal exposure to BPA on mean (±SEM) adipocyte number and volume in males from different prenatal treatment groups when 19 weeks old. Panel A: gonadal adipocyte number; Panel B: gonadal adipocyte volume; Panel C: renal adipocyte number Panel D: renal adipocyte volume. Groups with different letters are significantly different from each other. Panel D: b′, P= 0.055 vs. controls; c′, P= 0.07 vs. DES-0.1.
Fig. 4
Fig. 4
Effect of fetal exposure to BPA on mean (±SEM) liver weight in males from different prenatal treatment groups when 19 weeks old. Groups with different letters are significantly different from each other.
Fig. 5
Fig. 5
Panel A: glucose tolerance test (mean±SEM) area under the curve (AUC) after a 4-h fast in males from different prenatal treatment groups when about 18 weeks old. Blood glucose was measured during the 2 h after i.p. injection of glucose. Panel B: insulin tolerance test area under the curve (AUC) for blood glucose after i.p. injection of insulin using the same approach as for the glucose tolerance test. Groups with different letters are significantly different from each other; b′, P= 0.07 vs. controls.
Fig. 6
Fig. 6
Serum insulin, leptin, and adiponectin (mean ±SEM) concentrations in nonfasted males from different prenatal treatment groups when 19 weeks old. Panel A: serum insulin, Panel B: serum leptin, and Panel C: serum adiponectin. Groups with different letters are significantly different from each other.
Fig. 7
Fig. 7
Average serum unconjugated BPA levels in maternal and fetal serum over the 24 h between GD 17 and 18 (AUC0–24/24 h) after the last oral administration of 3H-BPA on GD 17. Pregnant females were fed a 20 μg/kg mixture of BPA and 3H-BPA one time per day between GD 11 and 17. Data for each BPA dose are based on linear interpolation, since administered dose is linear with internal serum concentration over a wider range of doses than were examined in this study [32].

Similar articles

Cited by

References

    1. Shuster A, Patlas M, Pinthus JH, Mourtzakis M. The clinical importance of visceral adiposity: a critical review of methods for visceral adipose tissue analysis. British Journal of Radiology. 2012;85:1–10. - PMC - PubMed
    1. Alonso-Magdalena P, Quesada I, Nadal A. Endocrine disruptors in the etiology of type 2 diabetes mellitus. Nature Reviews Endocrinology. 2011;7:346–53. - PubMed
    1. Kasturi SS, Tannir J, Brannigan RE. The metabolic syndrome and male infertility. Journal of Andrology. 2008;29:251–9. - PubMed
    1. Heindel JJ, vom Saal FS. Overview of obesity and the role of developmental nutrition and environmental chemical exposures. Molecular and Cellular Endocrinology. 2009;304:90–6. - PubMed
    1. Janesick A, Blumberg B. Obesogens, stem cells and the developmental programming of obesity. International Journal of Andrology. 2012;35:437–48. - PMC - PubMed

Publication types

MeSH terms

LinkOut - more resources