

TrAp: a tree approach for fingerprinting subclonal tumor composition
- PMID: 23892400
- PMCID: PMC3783191
- DOI: 10.1093/nar/gkt641
TrAp: a tree approach for fingerprinting subclonal tumor composition
Abstract
Revealing the clonal composition of a single tumor is essential for identifying cell subpopulations with metastatic potential in primary tumors or with resistance to therapies in metastatic tumors. Sequencing technologies provide only an overview of the aggregate of numerous cells. Computational approaches to de-mix a collective signal composed of the aberrations of a mixed cell population of a tumor sample into its individual components are not available. We propose an evolutionary framework for deconvolving data from a single genome-wide experiment to infer the composition, abundance and evolutionary paths of the underlying cell subpopulations of a tumor. We have developed an algorithm (TrAp) for solving this mixture problem. In silico analyses show that TrAp correctly deconvolves mixed subpopulations when the number of subpopulations and the measurement errors are moderate. We demonstrate the applicability of the method using tumor karyotypes and somatic hypermutation data sets. We applied TrAp to Exome-Seq experiment of a renal cell carcinoma tumor sample and compared the mutational profile of the inferred subpopulations to the mutational profiles of single cells of the same tumor. Finally, we deconvolve sequencing data from eight acute myeloid leukemia patients and three distinct metastases of one melanoma patient to exhibit the evolutionary relationships of their subpopulations.
Figures
 ,
,  ,
,  ,
,  and
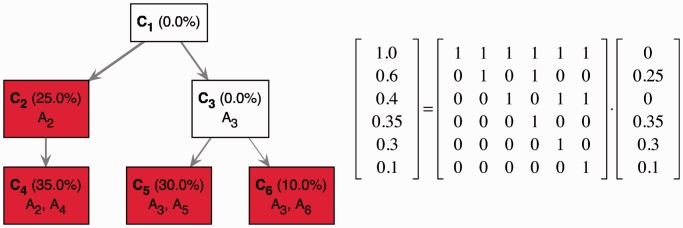
and  , respectively. In this example, the optimal TrAp solution is unique and has four populated subclones: C2 with aberrations
  , C4 with aberrations
  , C5 with aberrations
  and C6 with aberrations
  . The optimal solution is shown both as an evolutionary tree (left) and in matrix form according to Equation (1) (right), where the tree topology is encoded in the binary matrix and the relative composition of the subclones is represented in the column vector.
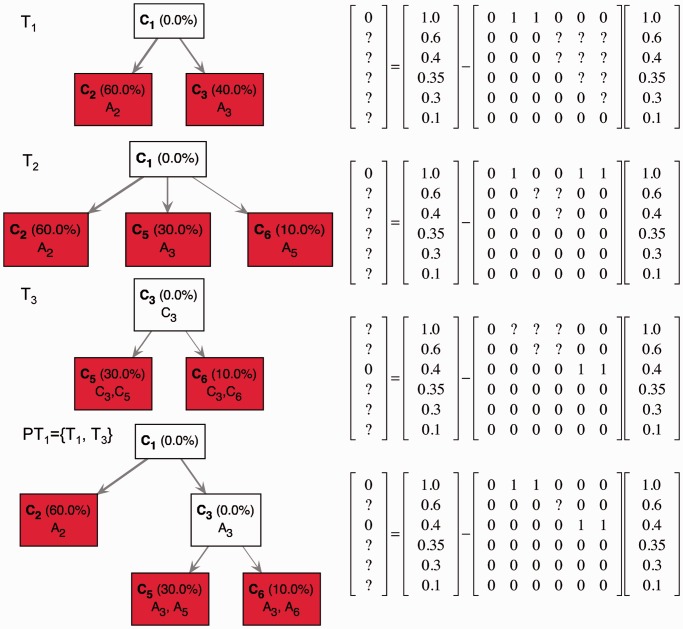
 is consistent with three first-generation trees
  ,
, 
 and
and  . Each first-generation tree is visualized as a matrix equation
  according to Equation (2) (left) and as a partial evolutionary tree (right). In the bottom row, the partial tree PT1 given by the union of the partial trees T1 and T3 is shown. Question marks indicate values that are unknown as they are not specified by the first-generation tree or by the partial tree.
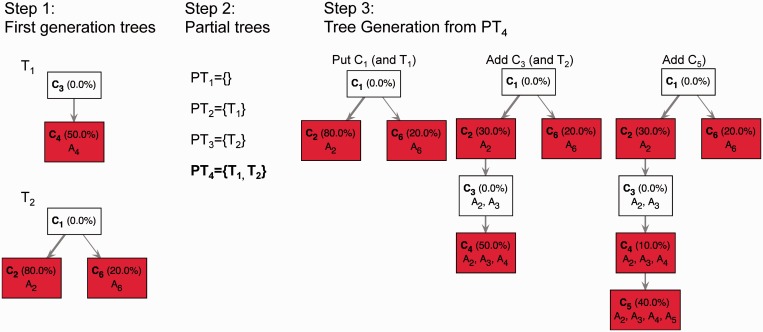
 ,
,  ,
,  ,
,  and
and  , respectively. The dummy measurement
  was also added to generate the aggregate signal frequency vector
  . In the first step, TrAp identifies all first-generation trees, namely
  and
and  . In the second step, TrAp generates the possible partial trees, namely
  ,
,  ,
,  and
and  , and consequently selects only
  , as it is the only partial tree that contains a maximum number of first-generation trees. In the third step, TrAp generates evolutionary trees starting from the partial tree
  . To complete the evolutionary tree starting from PT4, the subclone C1 is positioned as the root of the tree. Because C1 is part of the first-generation tree T1, the subclones C2 and C6 are automatically added as direct descendants of C1. Next, C3 is added as a direct descendant of C2. Because C3 is part of the first-generation tree T2, C4 is automatically added as direct descendant of C3. Finally, C5 is added as a direct descendant of C4, generating the optimal TrAp solution to the subclonal deconvolution problem. We remark that the optimal solution generated by the TrAp algorithm is equal to the left solution of
  in
in 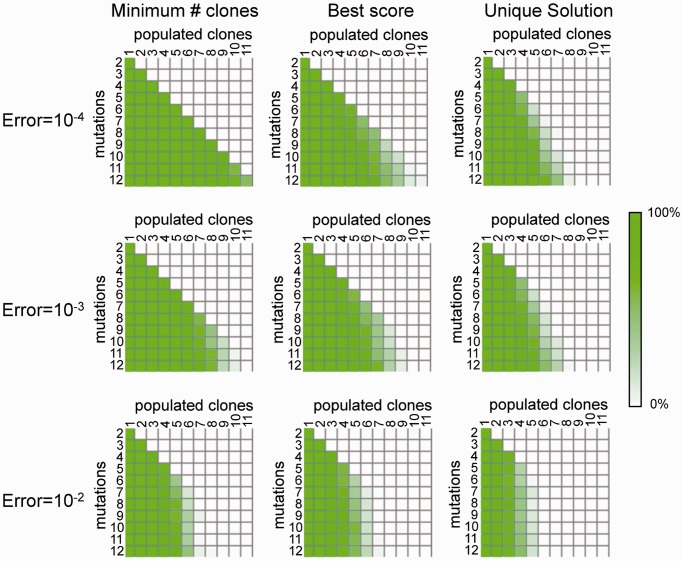
 . The heatmaps (tables) show the percentage of trees in each cell for which the true solution has the minimum number of subclones (left panel), is a TrAp solution (middle panel) and is the only TrAp solution (right panel) if the best solution is unique.
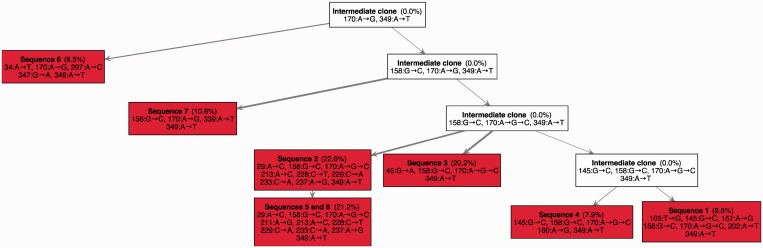
 . Since sequences five and eight are identical, they are grouped in a single clone whose relative frequency is
  . In total, 20 mutated nucleotides were found in the data, and two different mutations were identified at position 170. Mutations are shown using the notation ‘
 ’, e.g., the notation
  indicates that the nucleotide at position 170 was mutated from Adenine to Guanine. The notation
  indicates that the nucleotide at position 170 was mutated twice, first from Adenine to Guanine and then from Guanine to Cytosine. In this example, all seven subclones were correctly deconvolved by the TrAp algorithm, the frequency of the subclones was correctly estimated and the solution was unique.
References
-
- Nowell P. The clonal evolution of tumor cell populations. Science. 1976;194:23–28. - PubMed
-
- Anderson K, Lutz C, van Delft FW, Bateman CM, Guo Y, Colman SM, Kempski H, Moorman AV, Titley I, Swansbury J, et al. Genetic variegation of clonal architecture and propagating cells in leukaemia. Nature. 2011;469:356–361. - PubMed
-
- Cairns J. Mutation selection and the natural history of cancer. Sci. Aging Knowledge Environ. 2006;2006:cp1.
-
- Klein CA. Parallel progression of primary tumours and metastases. Nat. Rev. Cancer. 2009;9:302–312. - PubMed
Publication types
MeSH terms
Grants and funding
LinkOut - more resources
Full Text Sources
Other Literature Sources
