. 2013 Sep;41(17):e167.
doi: 10.1093/nar/gkt650. Epub 2013 Jul 27.

A new strategy for gene targeting and functional proteomics using the DT40 cell line

Affiliations

A new strategy for gene targeting and functional proteomics using the DT40 cell line

Kinga P Orlowska et al. Nucleic Acids Res. 2013 Sep.

Abstract

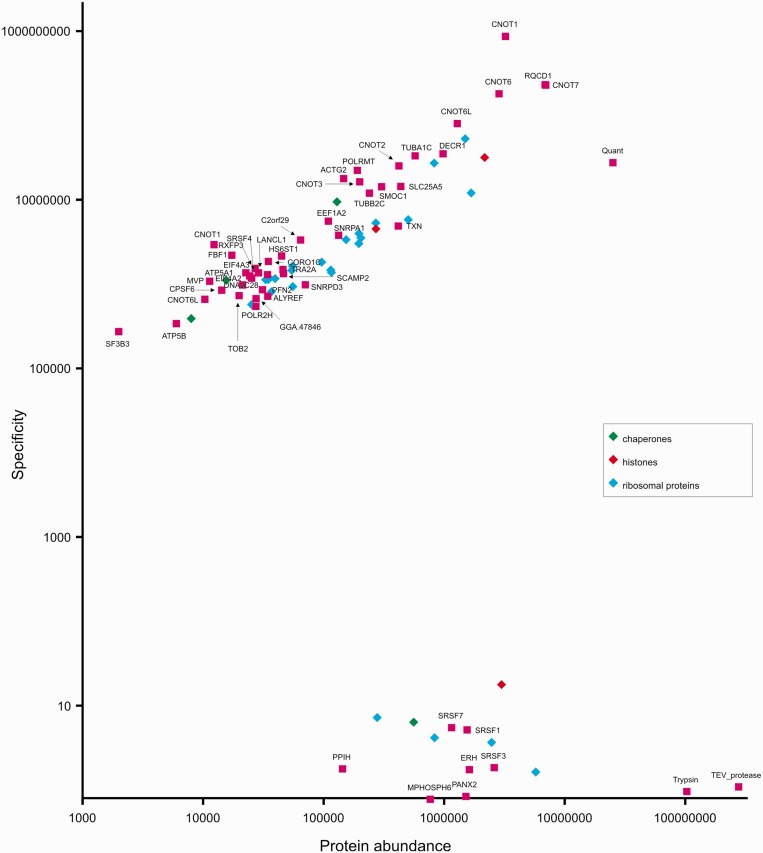
DT40 cells derived from chicken B lymphocytes exhibit exceptionally high homologous recombination rates. Therefore, they can be used as a convenient tool and model for gene targeting experiments. However, lack of efficient cloning strategies, protein purification protocols and a well annotated protein database limits the utility of these cells for proteomic studies. Here we describe a fast and inexpensive experimental pipeline for protein localization, quantification and mass spectrometry-based interaction studies using DT40 cells. Our newly designed set of pQuant vectors and a sequence- and ligation-independent cloning (SLIC) strategy allow for simple and efficient generation of gene targeting constructs, facilitating homologous-recombination-based protein tagging on a multi-gene scale. We also report proof of principle results using the key proteins involved in RNA decay, namely EXOSC8, EXOSC9, CNOT7 and UPF1.


Figures

Figure 1.
Figure 1.
C-terminal tags designed for tagging ORFs by gene targeting in DT40 cells. Each tag consists of a quantification peptide (Quant), a TEV protease cleavage site and a protein A, FLAG or EGFP tag. Sequences of the Quant peptide and the TEV protease recognized site are shown. Arrows indicate sites of tryptic cleavage.
Figure 2.
Figure 2.
Cloning of targeting constructs and cell line generation strategy. A SLIC method was implemented to enable high-throughput cloning of constructs for protein tagging. Inserts containing gene-specific ∼2.5 kb homology arms were created using DT40 genomic DNA as a template by two subsequent PCR reactions and recombined with HindIII/XhoI-digested vector. The gene targeting constructs were used for DT40 transfection after linearization with a single-cutting restriction enzyme (e.g. NotI, AscI, SnaBI, MluI, BglII). A set of vectors was designed, which enable homozygous C-terminal tagging with protein A, FLAG or EGFP and recycling of selection markers by Cre-mediated excision of resistance cassettes.
Figure 3.
Figure 3.
Knock-in of the QuantEGFP tag enables reliable analysis of protein localization and estimation of protein abundance in DT40 cells. (A) Analysis of cell population fluorescence by flow cytometry. (B) Analysis of the level of EGFP-tagged proteins during cell cycle progression. Parental cell line (WT) and its derivatives, homozygous UPF1-QuantEGFP and heterozygous cyclinB2-QuantEGFP, were analyzed. Cells were fixed, labeled with propidium iodide (to measure DNA content) and fluorescence was measured using flow cytometry. Points below the horizontal line represent cells negative for QuantEGFP. (C) Live cell fluorescence imaging of untransfected DT40 cells and stable cell lines expressing QuantEGFP-tagged CNOT7, EXOSC8, EXOSC9 or UPF1 protein.
Figure 4.
Figure 4.
Analysis of associations between CNOT7, EXOSC8, UPF1 and the translational machinery by polyribosome profiling. Extracts from cells treated with (red solid line) and without (blue dotted line) cycloheximide were fractionated by ultracentrifugation in 7–47% sucrose gradients. Tagged proteins were detected by western blotting using anti-GFP antibodies.
Figure 5.
Figure 5.
CoIP of QuantEGFP-tagged EXOSC8, EXOSC9, CNOT7 and UPF1 proteins (lanes 2, 3, 4, 5, respectively) and control purification using WT cells (lane 1). The band corresponding to TEV protease is indicated with an arrow.
Figure 6.
Figure 6.
Semiquantitative analysis of CoIP results using QuantEGFP-tagged CNOT7 protein as bait. Protein abundance was defined as the mean signal intensity calculated by MaxQuant software for a protein (mean value from two replicates) divided by its molecular weight. Specificity was defined as the ratio of protein signal intensity measured in the bait purification to background level (which is the protein signal intensity in the negative control purification; background level was arbitrarily set to 1 for proteins not detected in the negative control).

Similar articles

Cited by

References

    1. Gavin AC, Bosche M, Krause R, Grandi P, Marzioch M, Bauer A, Schultz J, Rick JM, Michon AM, Cruciat CM, et al. Functional organization of the yeast proteome by systematic analysis of protein complexes. Nature. 2002;415:141–147. - PubMed
    1. Ho Y, Gruhler A, Heilbut A, Bader GD, Moore L, Adams SL, Millar A, Taylor P, Bennett K, Boutilier K, et al. Systematic identification of protein complexes in Saccharomyces cerevisiae by mass spectrometry. Nature. 2002;415:180–183. - PubMed
    1. Gavin AC, Aloy P, Grandi P, Krause R, Boesche M, Marzioch M, Rau C, Jensen LJ, Bastuck S, Dumpelfeld B, et al. Proteome survey reveals modularity of the yeast cell machinery. Nature. 2006;440:631–636. - PubMed
    1. Huh WK, Falvo JV, Gerke LC, Carroll AS, Howson RW, Weissman JS, O'Shea EK. Global analysis of protein localization in budding yeast. Nature. 2003;425:686–691. - PubMed
    1. Krogan NJ, Cagney G, Yu H, Zhong G, Guo X, Ignatchenko A, Li J, Pu S, Datta N, Tikuisis AP, et al. Global landscape of protein complexes in the yeast Saccharomyces cerevisiae. Nature. 2006;440:637–643. - PubMed

Publication types