. 2013:3:2302.
doi: 10.1038/srep02302.

Mining large-scale response networks reveals 'topmost activities' in Mycobacterium tuberculosis infection

Affiliations

Mining large-scale response networks reveals 'topmost activities' in Mycobacterium tuberculosis infection

Awanti Sambarey et al. Sci Rep. 2013.

Abstract

Mycobacterium tuberculosis owes its high pathogenic potential to its ability to evade host immune responses and thrive inside the macrophage. The outcome of infection is largely determined by the cellular response comprising a multitude of molecular events. The complexity and inter-relatedness in the processes makes it essential to adopt systems approaches to study them. In this work, we construct a comprehensive network of infection-related processes in a human macrophage comprising 1888 proteins and 14,016 interactions. We then compute response networks based on available gene expression profiles corresponding to states of health, disease and drug treatment. We use a novel formulation for mining response networks that has led to identifying highest activities in the cell. Highest activity paths provide mechanistic insights into pathogenesis and response to treatment. The approach used here serves as a generic framework for mining dynamic changes in genome-scale protein interaction networks.


Figures
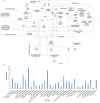
Figure 1
Figure 1. Modelling the macrophage response in tuberculosis.
(a) A molecular map describing responses triggered in the macrophage upon M.tb infection. A single macrophage is reflected in green, and elicits both intracellular (outlined in green) and extracellular (outlined in purple) responses upon encountering either complete mycobacteria or mycobacterial lipids and other components (highlighted in orange). Red arrows represent inhibitory influences, while black arrows indicate activation. (b) Distribution of 1888 proteins in 32 biological modules participating in the cellular response described in (a). Here, the module Cytokine shows highest representation of proteins while VEGF signalling has the least representation, in terms of number of proteins involved in that process.
Figure 2
Figure 2. Response networks and inter-module influences.
(a) Module-module influence network for PTB_M. Node sizes are reflective of the number of nodes and their cumulative expression in each module, while edge thickness indicates the number of influences between the connected modules and their interaction strength. Comparative expressions of 32 modules in (b) PTB_M and HC_M and (c) different states of treatment viz. PTB_0, PTB_2 and PTB_12 and healthy controls HC_B. In Figures 5, 6 and 7, each module is coloured differently indicated by the module labels in Figure 2(a).
Figure 3
Figure 3. Path Cost distribution reveals differences in activities.
(a) Path cost distribution across all 6 conditions. Paths with least cost, in the range 0–1 are considered to be of ‘highest activity’, while those in the range 1–2 are relatively ‘high activity’ paths. (b) Table showing number of paths falling in the highest and high activity regions respectively, for all conditions.
Figure 4
Figure 4. Module representation in highest activity paths.
(a) Percentage representation of modules in all the highest activity (Path Costs below 1) paths shown for monocytes in healthy conditions as well as in disease. (b) Percentage module representation in the highest activity paths upon treatment and in healthy controls.
Figure 5
Figure 5. Highest activity paths in PTB_M and HC_M forming well connected subnets.
Network of nodes and edges constituting highest activity paths with Path Costs below 1 for (a) PTB_M and (b) HC_M. (c) A zoomed-in sub-network representing unique highest activity paths in PTB_M. Nodes are coloured according to modules they belong to, and the edge thickness reflects the strength of the edge.
Figure 6
Figure 6. Illustrative example of interferon sub-networks showing alterations in different conditions.
Sub-networks are shown depicting paths from Interferon gamma receptors and Interferon alpha receptors to downstream target genes in different conditions. Node sizes correspond to node weights, while edge thickness reflects the interaction strength of the edge in a given condition. Nodes are coloured according to the modules they belong to.
Figure 7
Figure 7. Path activities in different conditions.
Example paths from a given source to target show variable Path Costs and thus variable activities in different conditions. The variation in activities are demonstrated by showing the differences in weights of nodes and edges constituting the path. Node sizes correspond to node weights, while edge thickness reflects the interaction strength of the edge in a given condition. Nodes are coloured according to the modules they belong to.

Similar articles

Cited by

References

    1. WHO. Report No. WHO/HTM/TB/2012.6. (2012).
    1. Casadevall A. & Pirofski L-a. Host-Pathogen Interactions: The Attributes of Virulence. J. Infect Dis. 184, 337–344 (2001). - PubMed
    1. Mukherjee S., Sambarey A., Prashanthi K. & Chandra N. Current trends in modeling host–pathogen interactions. Wiley Interdiscip Rev Data Min Knowl Discov. 3, 109–128 (2013).
    1. Kaufmann S. H. & Walker B. Host–pathogen interactions. Curr Opin Immunol. 19, 371–373 (2006). - PMC - PubMed
    1. Kirschner D. E. & Linderman J. J. Mathematical and computational approaches can complement experimental studies of host-pathogen interactions. Cell Microbiol. 11, 531–539 (2009). - PMC - PubMed

Publication types