Comparative Study
. 2013 Oct;347(1):100-16.
doi: 10.1124/jpet.113.206896. Epub 2013 Jul 26.

Comparative pharmacology of bombesin receptor subtype-3, nonpeptide agonist MK-5046, a universal peptide agonist, and peptide antagonist Bantag-1 for human bombesin receptors

Affiliations
Comparative Study

Comparative pharmacology of bombesin receptor subtype-3, nonpeptide agonist MK-5046, a universal peptide agonist, and peptide antagonist Bantag-1 for human bombesin receptors

Paola Moreno et al. J Pharmacol Exp Ther. 2013 Oct.

Abstract

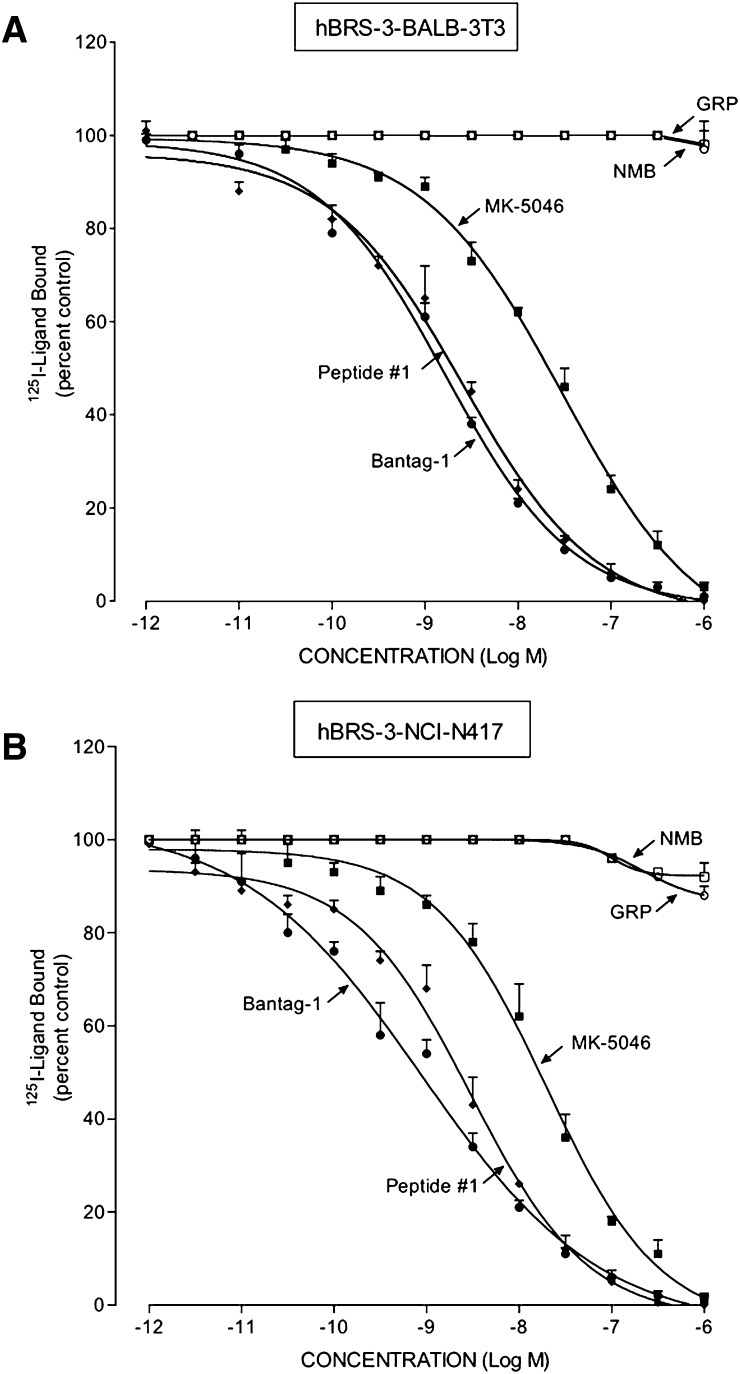
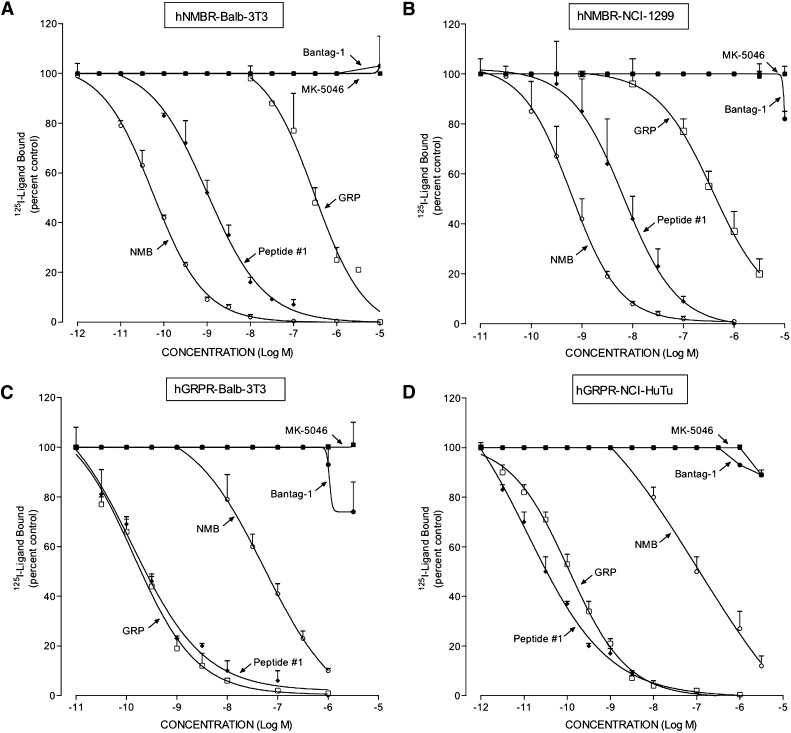
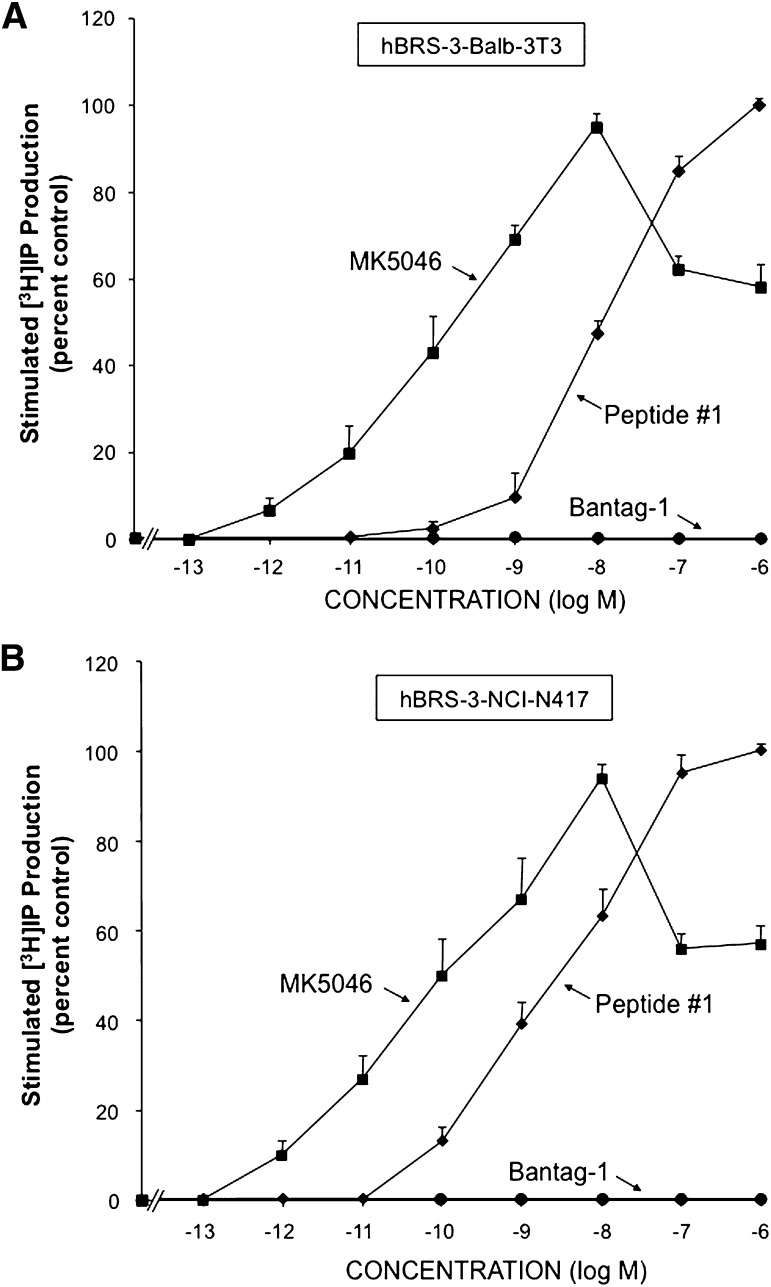
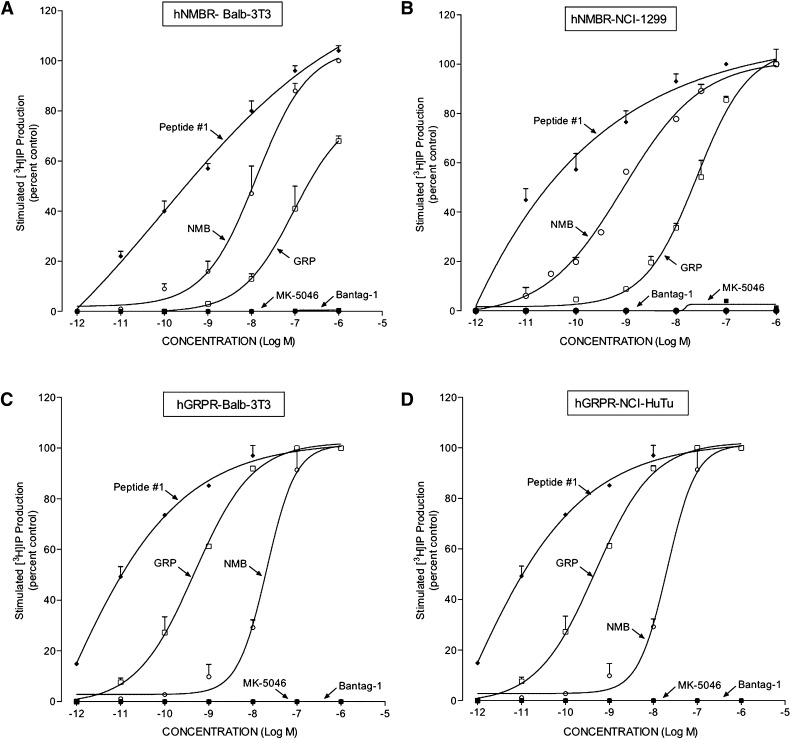
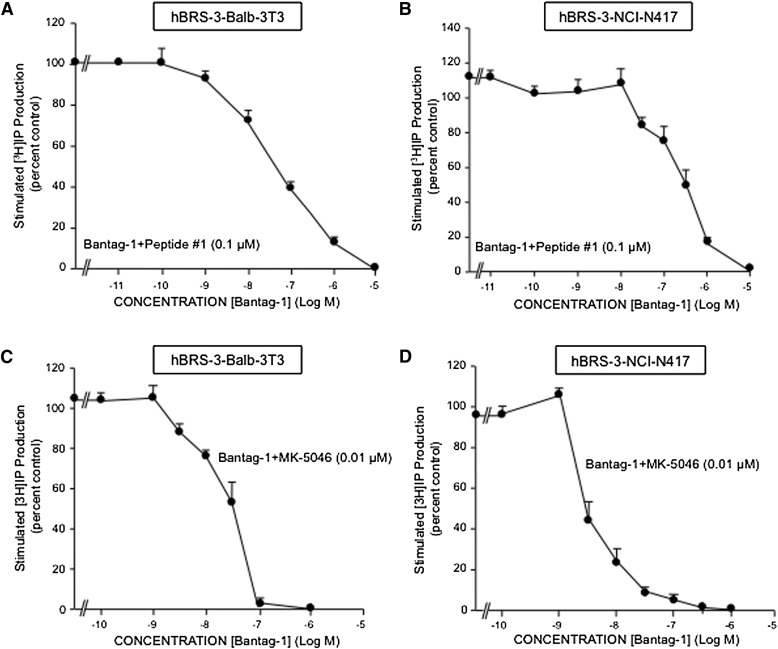
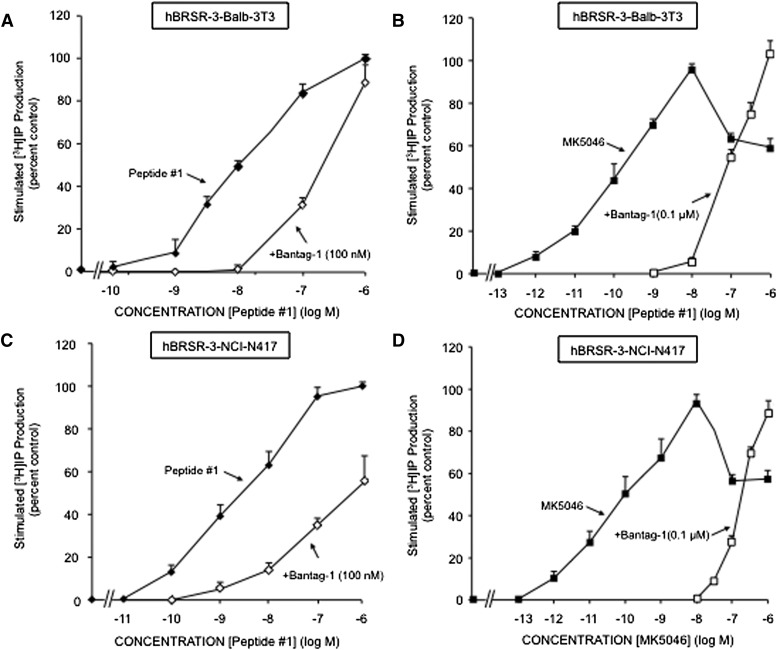
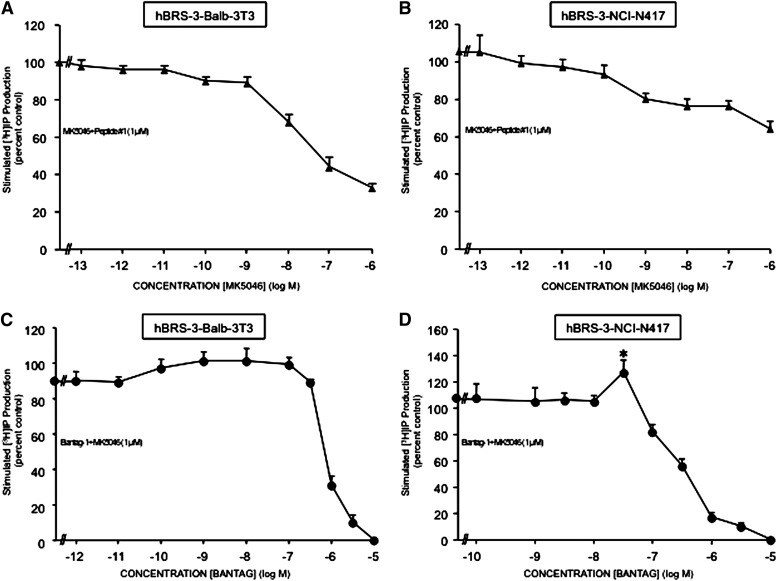
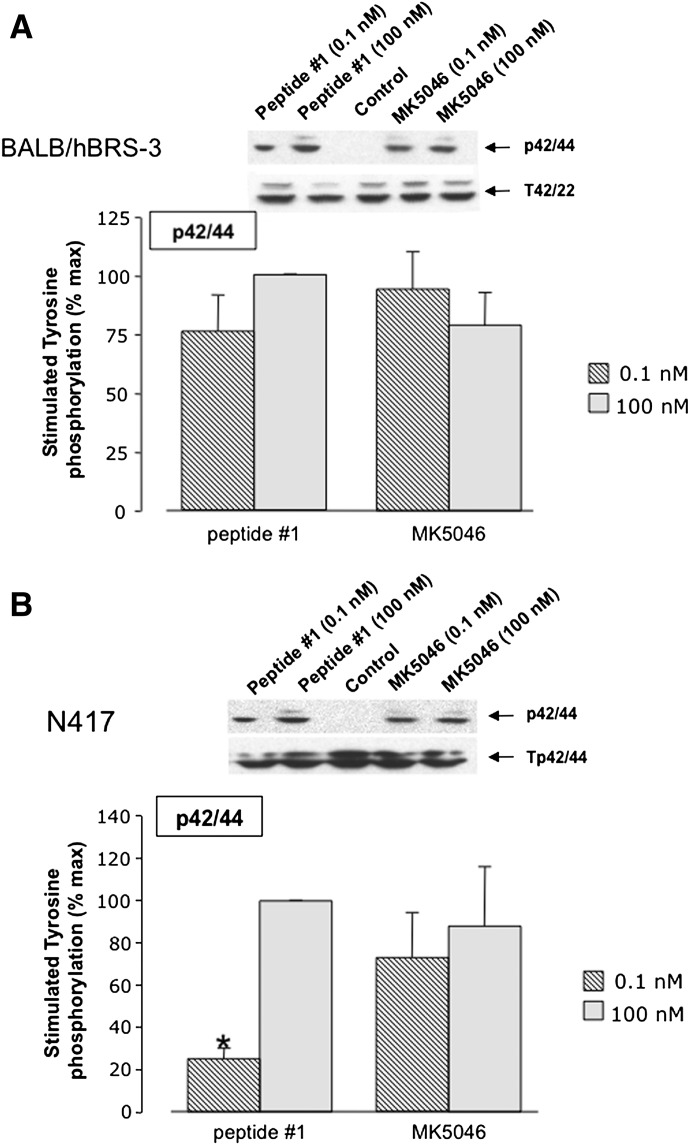
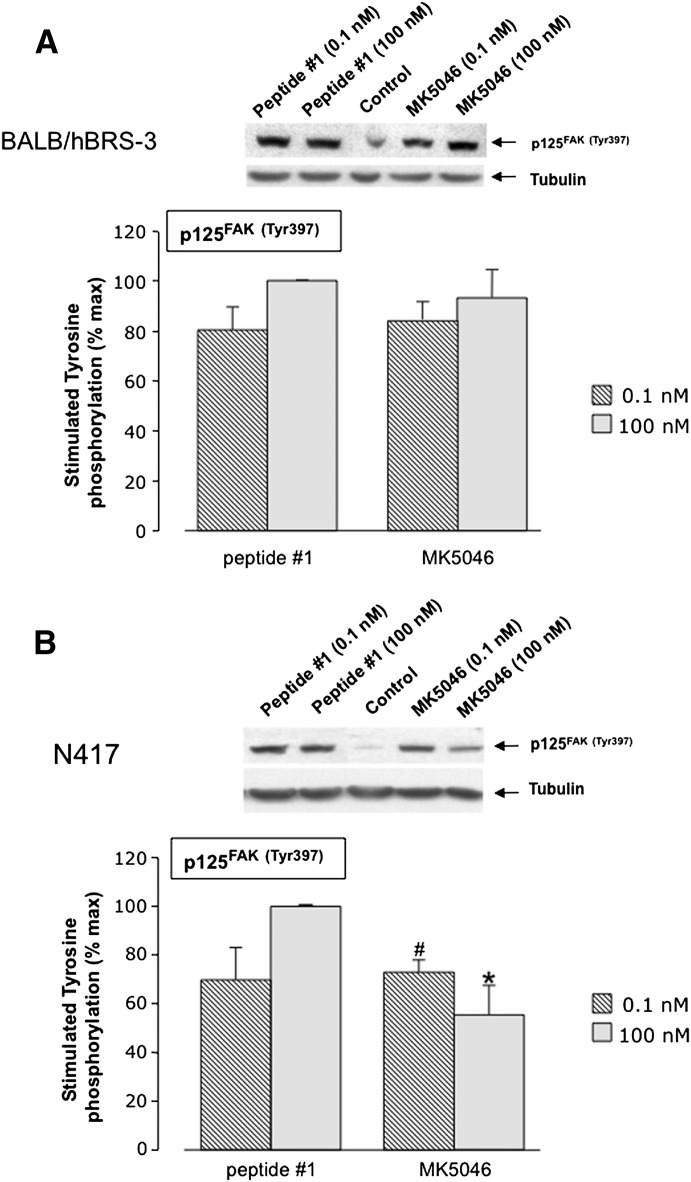
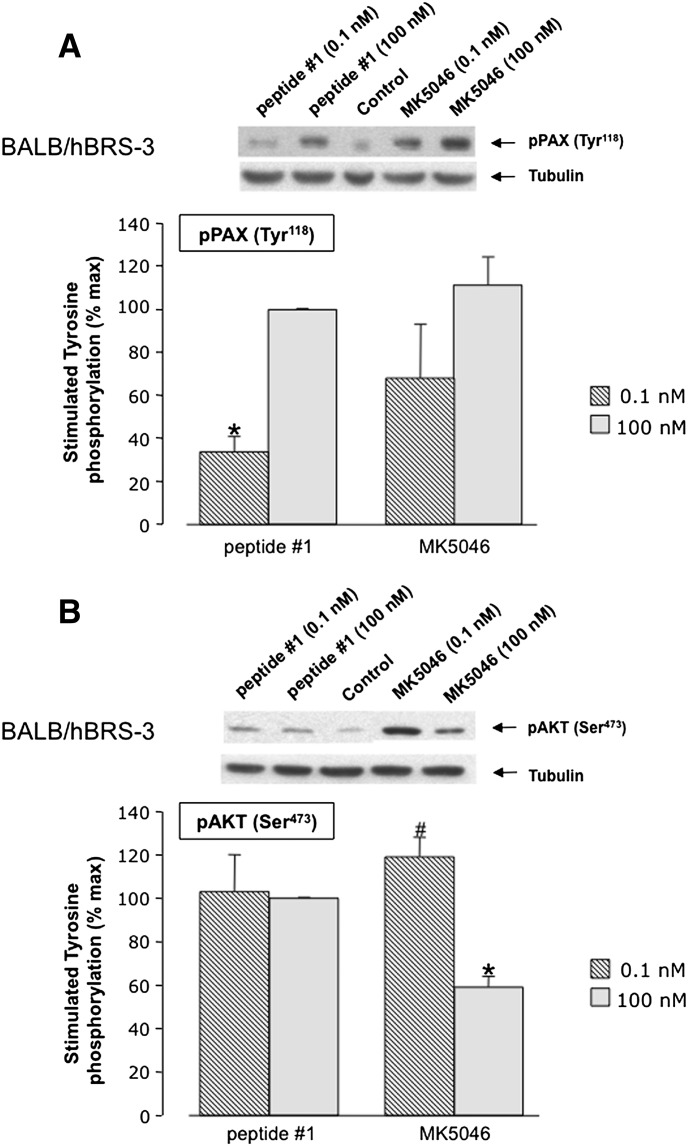
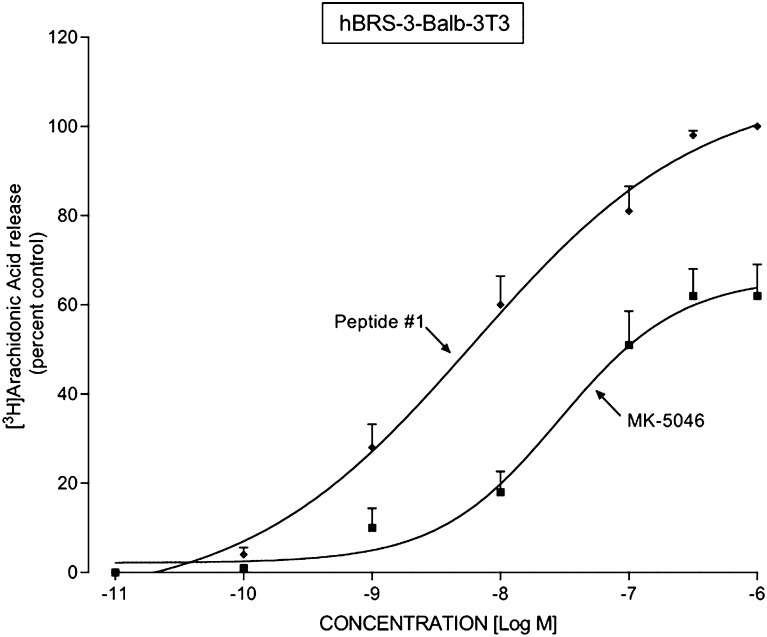
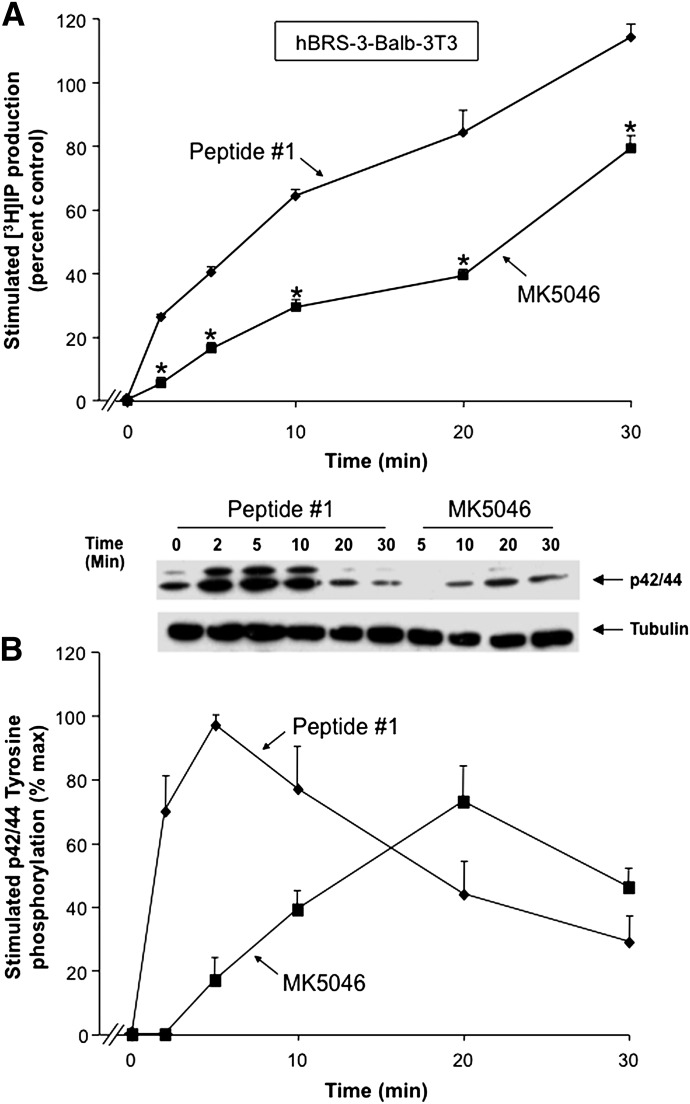
Bombesin-receptor-subtype-3 (BRS-3) is an orphan G-protein-coupled receptor of the bombesin (Bn) family whose natural ligand is unknown and which does not bind any natural Bn-peptide with high affinity. It is present in the central nervous system, peripheral tissues, and tumors; however, its role in normal physiology/pathophysiology is largely unknown because of the lack of selective ligands. Recently, MK-5046 [(2S)-1,1,1-trifluoro-2-[4-(1H-pyrazol-1-yl)phenyl]-3-(4-{[1-(trifluoromethyl)cyclopropyl]methyl}-1H-imidazol-2-yl)propan-2-ol] and Bantag-1 [Boc-Phe-His-4-amino-5-cyclohexyl-2,4,5-trideoxypentonyl-Leu-(3-dimethylamino) benzylamide N-methylammonium trifluoroacetate], a nonpeptide agonist and a peptide antagonist, respectively, for BRS-3 have been described, but there have been limited studies on their pharmacology. We studied MK-5046 and Bantag-1 interactions with human Bn-receptors-human bombesin receptor subtype-3 (hBRS-3), gastrin-releasing peptide receptor (GRP-R), and neuromedin B receptor (NMB-R)-and compared them with the nonselective, peptide-agonist [d-Tyr6,βAla11,Phe13,Nle14]Bn-(6-14) (peptide #1). Receptor activation was detected by activation of phospholipase C (PLC), mitogen-activated protein kinase (MAPK), focal adhesion kinase (FAK), paxillin, and Akt. In hBRS-3 cells, the relative affinities were Bantag-1 (1.3 nM) > peptide #1 (2 nM) > MK-5046 (37-160 nM) > GRP, NMB (>10 μM), and the binding-dose-inhibition curves were broad (>4 logs), with Hill coefficients differing significantly from unity. Curve-fitting demonstrated high-affinity (MK-5046, Ki = 0.08 nM) and low-affinity (MK-5046, Ki = 11-29 nM) binding sites. For PLC activation in hBRS-3 cells, the relative potencies were MK-5046 (0.02 nM) > peptide #1 (6 nM) > GRP, NMB, Bantag-1 (>10 μM), and MK-5046 had a biphasic dose response, whereas peptide #1 was monophasic. Bantag-1 was a specific hBRS-3-antagonist. In hBRS-3 cells, MK-5046 was a full agonist for activation of MAPK, FAK, Akt, and paxillin; however, it was a partial agonist for phospholipase A2 (PLA2) activation. The kinetics of activation/duration of action for PLC/MAPK activation of MK-5046 and peptide #1 differed, with peptide #1 causing more rapid stimulation; however, MK-5046 had more prolonged activity. Our study finds that MK-5046 and Bantag-1 have high affinity/selectivity for hBRS-3. The nonpeptide MK-5046 and peptide #1 agonists differ markedly in their receptor coupling, ability to activate different signaling cascades, and kinetics/duration of action. These results show that their hBRS-3 receptor activation is not always concordant and could lead to markedly different cellular responses.


Figures

Fig. 1.
Fig. 1.
Comparison of the affinities of the peptide agonists GRP, NMB, and peptide #1, nonpeptide agonist MK-5046, and the putative peptide antagonist Bantag-1 for the hBRS-3–receptor in (A) hBRS-3 Balb 3T3 cells and (B) NCI-N417 cells. The peptides were incubated with 50 pM 125I-[d-Tyr6,β-Ala11,Phe13,Nle14]Bn-(6–14) for 40–60 minutes at 21°C in 300 μl of binding buffer with hBRS-3 Balb 3T3 cells (0.5 × 10⁶ cells/ml) or NCI-N417 cells (1 × 10⁷ cells/ml), and the saturable binding was determined as described under Materials and Methods. The results are expressed as the percentage of saturable binding without unlabeled peptide added (percentage control). The results are the mean ± S.E.M. from at least four experiments, and in each experiment the data points were determined in duplicate.
Fig. 2.
Fig. 2.
Comparison of affinities of GRP, NMB, peptide #1, MK-5046, and Bantag-1 for cells containing hNMB-R and hGRP-R. Two different cell lines were used to assess human GRP-R interaction: hGRP-R–transfected Balb 3T3 (0.15 × 10⁶ cells/ml) (C) and HuTu-80 native hGRP-R cells (0.25 × 10⁶) (D). For hNMB-R interaction, hNMB-R–transfected Balb 3T3 (0.03 × 10⁶ cells/ml) (A) and NCI-1299 transfected cells (1 × 10⁶) (B) were used. The cells were incubated with 50 pM 125I-[d-Tyr6,β-Ala11,Phe13,Nle14]Bn-(6–14) for 40–60 minutes at 21°C in 300 μl of binding buffer either alone or with the indicated peptides, and the saturable binding was determined as described under Materials and Methods. The results are expressed as the percentage of saturable binding without unlabeled peptide added (percentage control). The results are the mean ± S.E.M. from at least four experiments, and in each experiment the data points were determined in duplicate.
Fig. 3.
Fig. 3.
Ability of the agonists peptide #1 and MK-5046 or the putative antagonist Bantag-1 to stimulate [3H]IP generation in two different cell types containing hBRS-3: (A) hBRS-3 Balb 3T3 and (B) NCI-N417. After loading the cells with 3 μCi/ml myo-[2-3H]inositol (as described under Materials and Methods), each cell type was incubated with each peptide at the indicated concentration for 60 minutes at 37°C. The [3H]IP measurement was determined as described under Materials and Methods. The results are the mean ± S.E.M. from at least four experiments, and in each experiment the data points were determined in duplicate. The results are expressed as the percentage of stimulation caused by the maximal effective concentration of peptide #1 (1 μM). (A) With hBRS-3 Balb 3T3 cells, the maximal stimulated [3H]IP value by 1 μM peptide #1 was 14,695 ± 1481 dpm, and the control value was 4142 ± 407 dpm (n = 5). (B) With NCI-N417 cells, the maximal stimulation of a 1 μM concentration of peptide #1 was 2897 ± 440 dpm, and the control value was 1251 ± 199 dpm (n = 24).
Fig. 4.
Fig. 4.
Comparison of the ability of GRP, NMB, peptide #1, MK-5046, and Bantag-1 to stimulate [3H]IP production in cells containing hNMB-R or hGRP-R. The experimental conditions were described in Fig. 3 and under Materials and Methods. The results are the mean ± S.E.M. from at least four experiments, and in each experiment the data points were determined in duplicate. The results are expressed as the percentage of stimulation causing by maximal effective concentration of peptide #1 (1 μM). The control and the maximal stimulated [3H]IP with peptide #1 (1 μM): (A) hNMB-R Balb 3T3 cells, 5336 ± 792 and 47,686 ± 6999 dpm, respectively (n = 6). (B) hNMB-R NCI-1299 cells, 748 ± 109 and 6688 ± 756 dpm, respectively (n = 6). (C) hGRP-R Balb 3T3 cells, 2192 ± 865 and 13,725 ± 4845 dpm, respectively (n = 4). (D) HuTu-80 cells, 1405 ± 219 and 11,266 ± 2973 dpm, respectively (n = 4).
Fig. 5.
Fig. 5.
Bantag-1 inhibits [3H]IP production in hBRS-3 Balb 3T3 (A and C) and NCI-N417 (B and D) cells. (A and B) Antagonist Bantag-1 alters [3H]IP production stimulated by 0.1 μM peptide #1. The results are expressed as the percentage of stimulation caused by peptide #1 (0.1 μM) alone. (C and D) Antagonist Bantag-1 inhibits [3H]IP generation stimulated by 0.01 μM MK-5046. The results are expressed as the percentage of stimulation caused by MK-5046 (0.01 μM) alone. The experimental conditions were described in Fig. 3 and under Materials and Methods. The results are the mean ± S.E.M. from at least four experiments, and in each experiment the data points were determined in duplicate.
Fig. 6.
Fig. 6.
Bantag-1 alters the dose-response curves of peptide #1 and MK-5046 stimulated [3H]IP in cells containing hBRS-3. (A and C) Effect of the antagonist Bantag-1 (100 nM) on the dose-response curve of peptide #1 for stimulating [3H] production. The results are expressed as the percentage of stimulation caused by a maximal effective concentration of peptide #1 (100 nM) alone. (B and D) Effect of Bantag-1 (100 nM) on the dose-response curve of MK-5046 for stimulating [3H] production. The results are expressed as the percentage of stimulation caused by the maximal effective concentration of MK-5046 (100 nM) alone.
Fig. 7.
Fig. 7.
Increasing concentrations of MK-5046 (A and B) or Bantag-1 (C and D) alter the maximal [3H]IP generation stimulated by peptide #1 (1 μM) (A and B) or by supramaximal MK-5046 (1 μM) (C and D) in hBRS-3 Balb 3T3 and NCI-417 cells. The experimental conditions were described under Materials and Methods. The results are the mean ± S.E.M. of at least four experiments, and in each experiment the data points were determined in duplicate. (A and B) Results expressed as the percentage of stimulation caused by a maximal effective concentration of peptide #1 (1 μM) alone. (C and D) Results expressed as a percentage of the stimulation caused by a supramaximal effective concentration of MK-5046 (1 μM) alone. *P < 0.05 versus 1 μM MK-5046 alone.
Fig. 8.
Fig. 8.
Peptide #1 and MK-5046 activate MAPK in two different human BRS-3 cell lines: (A) Balb 3T3 or (B) NCI-N417. Above each panel are the representative Western blots of p42/44 MAPK phosphorylation in Balb/hBRS-3 cells. Results are shown of NCI-417 cells treated with 0.1 nM and 100 nM peptide #1 or MK-5046 and incubated for 3 minutes at 37°C. Each panel shows the mean ± S.E.M. from at least four experiments. The results are expressed as the percentage of the maximal concentration of peptide #1 (100 nM). *P < 0.05 versus 100 nM peptide #1.
Fig. 9.
Fig. 9.
Peptide #1 and MK-5046 stimulate Tyr397 phosphorylation of FAK in (A) hBRS-3-transfected Balb 3T3 cells and (B) NCI-N417 native hBRS-3 cells. Above each panel are representative Western blots of the stimulation of p125FAK(Tyr397) in Balb 3T3 cells (A) and NCI-N417 cells (B) treated with 0.1 nM and 100 nM of peptide #1 or MK-5046 and incubated for 3 minutes at 37°C. Each panel shows the mean ± S.E.M. from at least four experiments. The results are expressed as the percentage of the maximal concentration of peptide #1 (100 nM). *P < 0.05 versus 100 nM peptide #1. #P < 0.05 versus 100 nM MK-5046.
Fig. 10.
Fig. 10.
Peptide #1 and MK-5046 stimulate Tyr118 phosphorylation of (A) paxillin and (B) Ser473 phospho-Akt in hBRS-3 Balb 3T3 transfected cells. Above each panel are representative Western blots of the stimulation of paxillin phosphorylation in cells treated with 0.1 nM and 100 nM of peptide #1 or MK-5046 for 3 minutes at 37°C. Each panel provides the results of densitometry analysis with the mean ± S.E.M. from at least four experiments. The results are expressed as the percentage of maximal concentration of peptide #1 (100 nM). *P < 0.05 versus 100 nM peptide #1. #P < 0.05 versus 100 nM MK-5046.
Fig. 11.
Fig. 11.
Peptide #1 and MK-5046 stimulate [3H]arachidonic acid release in hBRS-3 Balb 3T3 transfected cells. The hBRS-3 Balb cells (5 × 10⁴ cells/ml) were incubated with [3H-5,6,8,9,11,12,14,15]arachidonic acid (1 μCi/4 ml, [3H]AA) for 24 hours at 37°C, washed, and incubated with the indicated unlabeled concentration of MK-5046 or peptide #1 for 40 minutes at 37°C. [3H]AA release was determined as described under Materials and Methods. The results are expressed as the percentage of the release seen with a maximally effective concentration of peptide #1 (1 μM) and are the mean ± S.E.M. from at least four experiments. In each experiment, the data points were determined in duplicate. The control and the maximal stimulated (1 μM peptide #1) values were 901 ± 94 and 1542 ± 113 dpm, respectively (n = 5).
Fig. 12.
Fig. 12.
Time course of peptide #1 and MK-5046 stimulation of [3H]IP production and p42/44 MAPK phosphorylation in hBRS-3 Balb 3T3 transfected cells. (A) Maximal concentration of the agonists peptide #1 (10 nM) and MK-5046 (100 nM) to stimulate [3H]IP generation. The experiment was performed as described in Fig. 3 and under Materials and Methods, and the results are expressed as the percentage of control over basal stimulation. (B) Representative Western blot of p42/44 MAPK phosphorylation in Balb/hBRS-3 cells, and results of the experiment performed as described in Fig. 8 and under Materials and Methods. The concentrations are the same as in A. The results are expressed as the percentage of maximum stimulation caused by a maximal effective concentration of peptide # 1 (10 nM). The results in both panels are the mean ± S.E.M. from at least four experiments, and in each experiment the data points were determined in duplicate. *P < 0.05 versus peptide #1.

Similar articles

Cited by

References

    1. Aramori I, Zenkoh J, Morikawa N, Asano M, Hatori C, Sawai H, Kayakiri H, Satoh S, Inoue T, Abe Y, et al. (1997) Nonpeptide mimic of bradykinin with long-acting properties at the bradykinin B2 receptor. Mol Pharmacol 52:16–20 - PubMed
    1. Asano M, Hatori C, Sawai H, Johki S, Inamura N, Kayakiri H, Satoh S, Abe Y, Inoue T, Sawada Y, et al. (1998) Pharmacological characterization of a nonpeptide bradykinin B2 receptor antagonist, FR165649, and agonist, FR190997. Br J Pharmacol 124:441–446 - PMC - PubMed
    1. Benya RV, Fathi Z, Kusui T, Pradhan T, Battey JF, Jensen RT. (1994) Gastrin-releasing peptide receptor-induced internalization, down-regulation, desensitization, and growth: possible role for cyclic AMP. Mol Pharmacol 46:235–245 - PubMed
    1. Benya RV, Kusui T, Pradhan TK, Battey JF, Jensen RT. (1995) Expression and characterization of cloned human bombesin receptors. Mol Pharmacol 47:10–20 - PubMed
    1. Benya RV, Wada E, Battey JF, Fathi Z, Wang LH, Mantey SA, Coy DH, Jensen RT. (1992) Neuromedin B receptors retain functional expression when transfected into BALB 3T3 fibroblasts: analysis of binding, kinetics, stoichiometry, modulation by guanine nucleotide-binding proteins, and signal transduction and comparison with natively expressed receptors. Mol Pharmacol 42:1058–1068 - PubMed

Publication types

Substances

LinkOut - more resources