. 2013 Sep;45(9):1004-12.
doi: 10.1038/ng.2715. Epub 2013 Jul 28.

Loss of cilia suppresses cyst growth in genetic models of autosomal dominant polycystic kidney disease

Affiliations

Loss of cilia suppresses cyst growth in genetic models of autosomal dominant polycystic kidney disease

Ming Ma et al. Nat Genet. 2013 Sep.

Abstract

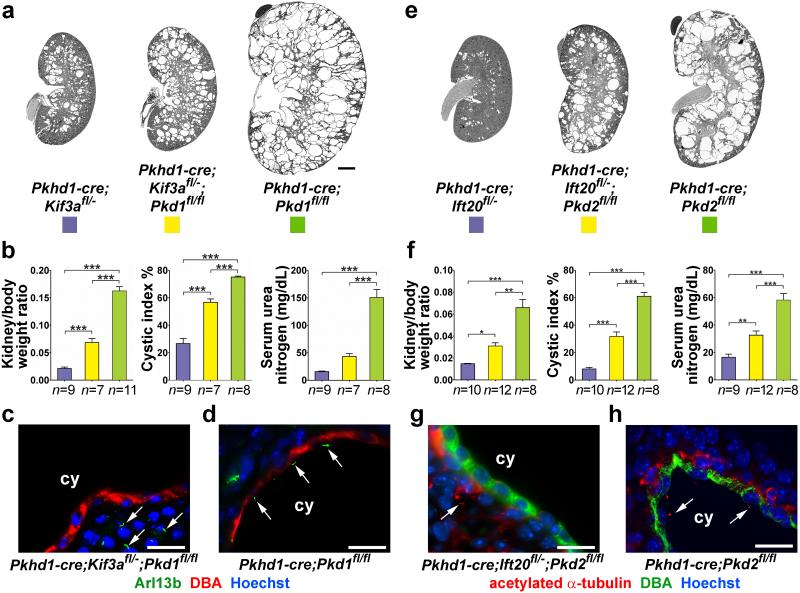
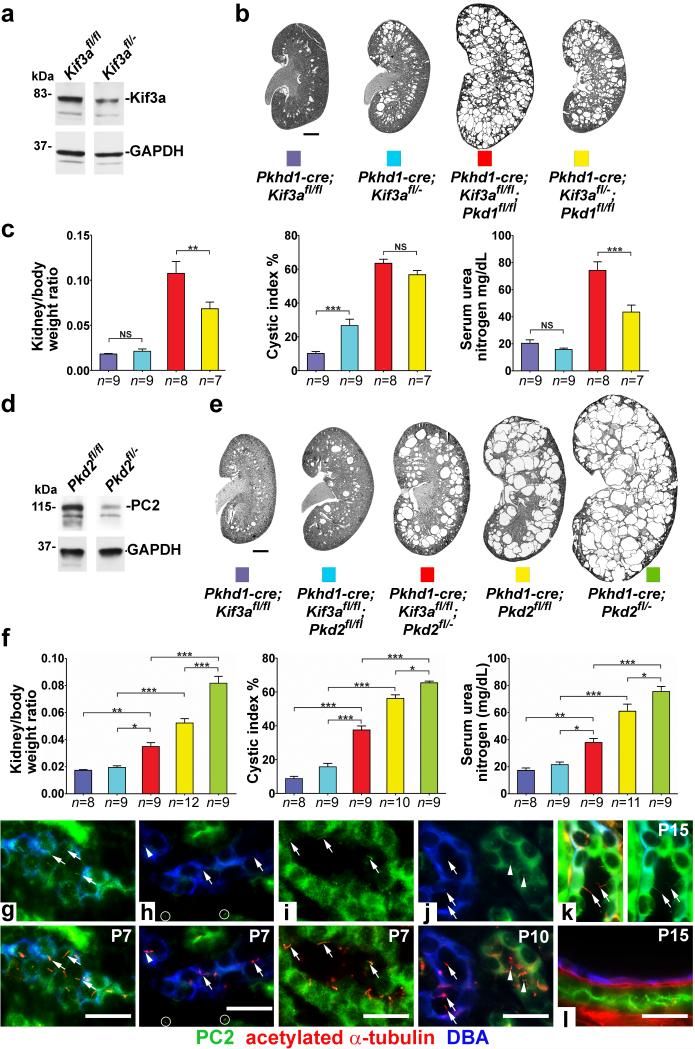
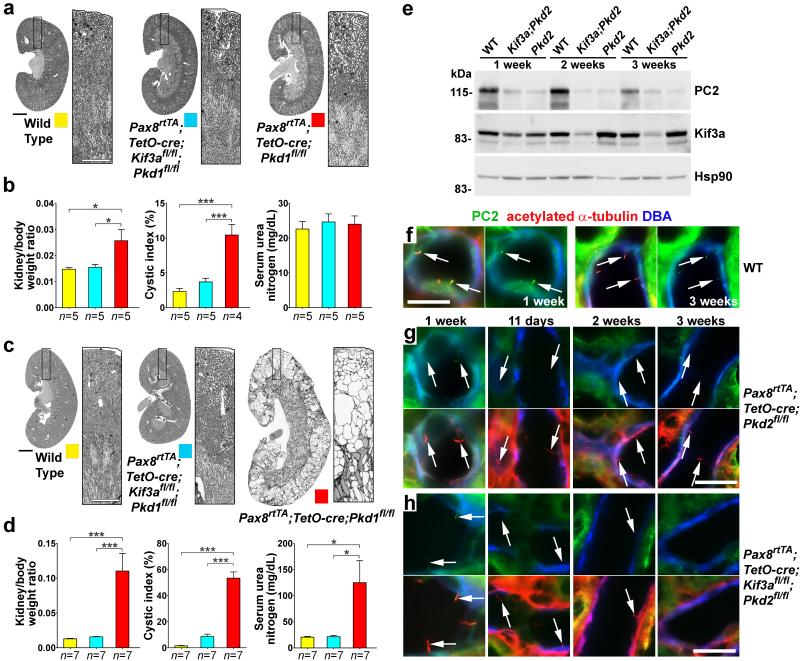
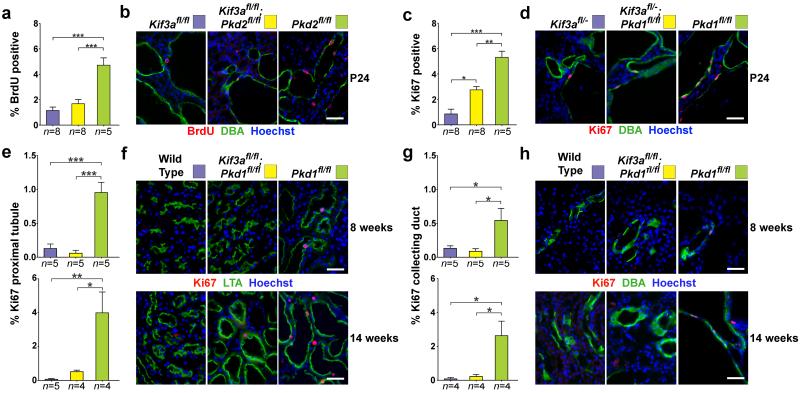
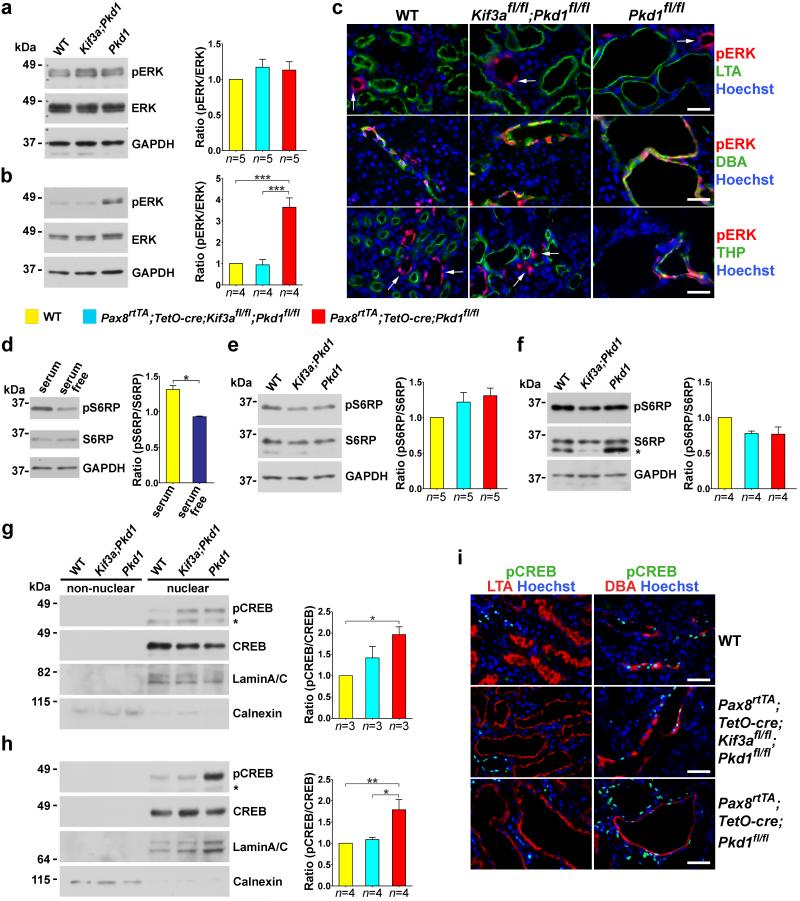
Kidney cysts occur following inactivation of polycystins in otherwise intact cilia or following complete removal of cilia by inactivation of intraflagellar transport-related proteins. We investigated the mechanisms of cyst formation in these two distinct processes by combining conditional inactivation of polycystins with concomitant ablation of cilia in developing and adult kidney and liver. We found that loss of intact cilia suppressed cyst growth following inactivation of polycystins and that the severity of cystic disease was directly related to the length of time between the initial loss of the polycystin proteins and the subsequent involution of cilia. This cilia-dependent cyst growth was not explained by activation of the MAPK/ERK, mTOR or cAMP pathways and is likely to be distinct from the mechanism of cyst growth following complete loss of cilia. These data establish the existence of a new pathway defined by polycystin-dependent inhibition and cilia-dependent activation that promotes rapid cyst growth.


Figures

Figure 1
Figure 1. Concomitant ablation of cilia ameliorates progression of ADPKD
Double inactivation of cilia and polycystins reduces cyst formation irrespective of the polycystin gene involved (Pkd1, a-d, Pkd2, e-h), the gene targeted for cilia ablation (Kif3a, a-d, Ift20, e-h). Representative images (a, e) and aggregate quantitative data (b, f) of kidney-to-body weight ratio, percent cystic area (cystic index) and serum urea nitrogen with the indicated genotypes. Immunohistochemistry showing (c, g) absence of cilia in cilia-polycystin double mutants and (d, h) presence of cilia in polycystin-only single mutants. Mice were examined at P24. Arrows indicate cilia. The color squares represent the respective genotypes in the histograms. The numbers of animals (n) in each group are indicated below the histogram bars. Multiple group comparisons were performed using one-way ANOVA followed by Tukey’s multiple comparison test and are presented as the mean ± SEM (***, P<0.001; **, P<0.01; *, P<0.05). Scale bar, 2 mm for a, e; 20 μm for c, d, g, h.
Figure 2
Figure 2. Polycystic disease severity is directly related to the length of time between polycystin loss and involution of cilia
Extending the time interval between loss of polycystins and the subsequent involution of cilia by varying the gene dosage of Kif3a (a-c) or Pkd2 (d-f) results in increased cyst growth. Immunoblotting shows higher steady state levels of the respective proteins at P10 (a) in Kif3afl/fl compared to Kif3afl/− and (d) in Pkd2fl/fl compared to Pkd2fl/− kidneys. (b, e) Representative images and (c, f,) aggregate quantitative data for kidneys with the indicated genotypes at P24. Cilia in Kif3afl/fl kidneys disappear later (P14) than in Kif3afl/− kidneys (P11) resulting in more severe polycystic disease in Kif3afl/fl;Pkd1fl/fl double mutants (red vs. yellow). Lower initial levels of PC2 in Pkd2fl/− mice result in earlier disappearance of PC2 and increased disease severity in cilia-PC2 double mutants compared (red) to Pkd2fl/fl double mutants (blue). The numbers of animals (n) in each group are indicated below the histogram bars. Multiple group comparisons were performed using one-way ANOVA followed by Tukey’s multiple comparison test and are presented as the mean ± SEM (***, P<0.001; **, P<0.01; *, P<0.05; NS, not significant). It should be noted that Pkhd1-cre; Kif3afl/− (blue) and Pkhd1-cre; Kif3afl/−; Pkd1fl/fl (yellow) in b, c are the same mice as in Fig. 1a, b compared to the respective aged matched Kif3afl/fl mice; although analyzed by ANOVA, only the relevant comparisons are shown. (g-l) Immunofluorescence studies showing the earlier disappearance of PC2 and subsequent involution of cilia. (g) Wild type P7 mouse kidney sections showing cilia (arrows) marked by acetylated α-tubulin (red, lower panel) in collecting ducts (blue) expressing PC2 (green, upper panel); (k), wild type kidney at P15. Collecting ducts at P7 in Pkhd1-cre; Kif3afl/fl; Pkd2fl/fl double mutant mice (h) show that most cilia (arrows, bottom panel) no longer express PC2 (top panel) although low level expression is occasionally observed in a few cilia (arrowhead). Non-collecting duct segments that do not express Cre in the same tissue sections continue to express PC2 in cilia (i; circles in h). At P10 (j), collecting duct cilia (arrows, lower) are completely devoid of PC2 (arrows, upper) while adjacent tubules where Cre is not active continue to express PC2 in cilia (arrowheads). By P15 (l), collecting ducts no longer have cilia. Scale bar, 2 mm for b, e; 20 μm for g-l.
Figure 3
Figure 3. Disruption of cilia reduces kidney cyst growth in adult onset ADPKD
Representative images of kidneys with the specified genotypes at (a) 8 weeks and (c) 14 weeks after the start of induction (mice aged 12 and 18 weeks, respectively); boxed regions are enlarged in the panel to the right of the kidney image. (b, d) Aggregate analysis of kidney weight-to-body weight ratio, cystic index and serum urea nitrogen at (b) 8 weeks and (d) 14 weeks after the start of induction. The color squares represent the respective genotypes in the histograms. The numbers of animals (n) in each group are indicated below the histogram bars. Multiple group comparisons were performed using one-way ANOVA followed by Tukey’s multiple comparison test and are presented as the mean ± SEM (***, P<0.001; *, P<0.05). (e) Immunoblot analysis of PC2 and Kif3a protein levels in control, Pax8rtTA; TetO-cre; Kif3afl/fl; Pkd2fl/fl (Kif3a;Pkd2) and Pax8rtTA; TetO-cre; Pkd2fl/fl (Pkd2) mice at 1, 2 and 3 weeks after the start of doxycycline induction. PC2 expression is already markedly reduced at 1 week after the start of induction in double knockouts whereas comparable reduction in Kif3a is observed at 2 weeks after starting induction; HSP90 was used as loading control. (f-h) Immunofluorescence using anti-PC2 (green), anti-acetylated α-tubulin (red) and DBA (pseudo-blue) showing the relative timing of loss of PC2 and involution of cilia in adult inactivation models. (f) Control kidney express PC2 in cilia at 1 and 3 weeks. Left panels, merged image; right panel, PC2. (g) Pkd2-only mutant kidneys show loss of PC2 by 11 days after the start of doxycycline induction. (h) Kif3a;Pkd2 double mutant kidneys show that cilia devoid of PC2 are present at 11 days following start of doxycycline. Cilia persist at 2 weeks following start of doxycycline, although in reduced numbers. Cilia are totally absent by 3 weeks following the start of doxycycline. (g, h) Top panels show PC2 and bottom panels show merged image. Arrows, cilia. Scale bars: a, c, 2 mm; f-h, 20 μm.
Figure 4
Figure 4. Loss of cilia in ADPKD suppresses cyst growth through reduction of cyst cell proliferation
(a) Aggregate quantitative analysis of the percentage of BrdU-positive nuclei and (c) Ki67 positive nuclei and the respective representative images (b, d) at P24 in an allelic series of the specified genotypes using inactivation by Pkhd1-cre. Quantitation of proliferation was determined by counting the number of BrdU or Ki67 positive nuclei amongst at least 1000 DBA positive cells in each mouse. Aggregate quantitative data (e, g) and representative images (f, h) with the indicated genotypes combined with Pax8rtTA; TetO-cre at 8 and 14 weeks after the start of doxycycline induction (respective ages, 12 and 18 weeks). Segment-specific adult model proliferation rates were determined for proximal tubules (e, f) and collecting ducts (g, h). The color squares in b, d, f and h correspond to the respective genotypes in the histograms in a, c, e and g. The numbers of animals (n) in each group are indicated below the histogram bars. Multiple group comparisons were performed using one-way ANOVA followed by Tukey’s multiple comparison test and are presented as the mean ± SEM (***, P<0.001; **, P<0.01; *, P<0.05). Scale bar, 40 μm.
Figure 5
Figure 5. In vivo MAPK/ERK, mTOR and cAMP signaling as a function of cilia ablation in ADPKD
(a-c) In vivo phosphorylation of ERK1/2 (pERK) in wild type, Pax8rtTA; TetO-cre; Kif3afl/fl; Pkd1fl/fl and Pax8rtTA; TetO-cre; Pkd1fl/fl at (a) 8 weeks and (b, c) 14 weeks after the start of induction with doxycycline. Representative immunoblots and aggregate densitometric quantitation of kidney lysates show that pERK is not increased in any genotype at 8 weeks (a) and is elevated at 14 weeks (b) only in the cystic Pkd1 single knockouts. (c) Immunohistochemical evidence of pERK expression at 14 weeks after induction is commonly found in CD irrespective of genotype; it is ubiquitously absent from proximal tubule irrespective of the extent of cyst formation; and it appears in thick ascending loop of Henle only in Pax8rtTA; TetO-cre; Pkd1fl/fl cystic mice. The increase in pERK in kidney lysates at 14 weeks is at least partly the result of increased cell mass of DBA positive CD cells comprising cysts. Arrows show positive pERK expression in segments other than proximal tubule (top panels) and thick ascending loop of Henle (bottom panels). (d-f) Phosphorylation of the mTOR pathway activation substrate S6RP. (d) Serum starvation of cultured cells is known to downregulate mTOR and result in decreased pS6RP, confirming the specificity of the antibody (n=4 for each group). Comparisons were performed using Mann-Whitney test and are presented as the mean ± SEM (*, P<0.05). (e, f) Representative immunoblots and aggregate densitometric quantitation of kidney lysates show no change in pS6RP irrespective of genotype and extent of cyst formation at (e) 8 weeks and (f) 14 weeks after the start of Cre induction suggesting that the mTOR pathway is not activated in these adult models. (*) in f, non-specific band. (g-i) In vivo cAMP-dependent phosphorylation of CREB (pCREB) at (g) 8 weeks and (h, i) 14 weeks after the start of Cre induction. Representative immunoblots and aggregate densitometric quantitation showing nuclear and non-nuclear fractions of kidney tissue lysates. pCREB activity is elevated at (g) 6 weeks and (h) 12 weeks only in Pax8rtTA; TetO-cre; Pkd1fl/fl cystic mice. (*) in g, h denote the phosphorylated form of cyclic AMP-dependent transcription factor ATF-1 that is known to cross react with the pCREB antibody. LaminA/C and calnexin are used to show relative nuclear enrichment and control loading. (i) Immunohistochemistry of pCREB expression at 14 weeks after induction shows nuclear staining in CD that is markedly increased in Pax8rtTA; TetO-cre; Pkd1fl/fl cystic mice. pCREB is completely absent from LTA positive PT irrespective of genotype or degree of cystic transformation. Pax8rtTA; TetO-cre; Pkd1fl/fl cystic mice also show increased pCREB in nuclei of segments that are negative for DBA (lower right panel). The color squares in the legend correspond to the respective genotypes in the histograms. The numbers of animals (n) in each group are indicated below the histogram bars. Multiple group comparisons were performed using one-way ANOVA followed by Tukey’s multiple comparison test and are presented as the mean ± SEM except as indicated above (***, P<0.001; **, P<0.01; *, P<0.05). Scale bar, 40 μm.

Comment in

Similar articles

Cited by

References

    1. Grantham JJ, Mulamalla S, Swenson-Fields KI. Why kidneys fail in autosomal dominant polycystic kidney disease. Nat.Rev.Nephrol. 2011 - PubMed
    1. Gerdes JM, Davis EE, Katsanis N. The vertebrate primary cilium in development, homeostasis, and disease. Cell. 2009;137:32–45. - PMC - PubMed
    1. Sharma N, Berbari NF, Yoder BK. Ciliary dysfunction in developmental abnormalities and diseases. Curr Top Dev Biol. 2008;85:371–427. - PubMed
    1. Hildebrandt F, Benzing T, Katsanis N. Ciliopathies. The New England journal of medicine. 2011;364:1533–1543. - PMC - PubMed
    1. Pedersen LB, Rosenbaum JL. Intraflagellar transport (IFT) role in ciliary assembly, resorption and signalling. Curr Top Dev Biol. 2008;85:23–61. - PubMed

Publication types

Substances