. 2013 Sep;14(9):917-26.
doi: 10.1038/ni.2670. Epub 2013 Jul 28.

The scavenger receptor SCARF1 mediates the clearance of apoptotic cells and prevents autoimmunity

Affiliations

The scavenger receptor SCARF1 mediates the clearance of apoptotic cells and prevents autoimmunity

Zaida G Ramirez-Ortiz et al. Nat Immunol. 2013 Sep.

Abstract

The clearance of apoptotic cells is critical for the control of tissue homeostasis; however, the full range of receptors on phagocytes responsible for the recognition of apoptotic cells remains to be identified. Here we found that dendritic cells (DCs), macrophages and endothelial cells used the scavenger receptor SCARF1 to recognize and engulf apoptotic cells via the complement component C1q. Loss of SCARF1 impaired the uptake of apoptotic cells. Consequently, in SCARF1-deficient mice, dying cells accumulated in tissues, which led to a lupus-like disease, with the spontaneous generation of autoantibodies to DNA-containing antigens, activation of cells of the immune system, dermatitis and nephritis. The discovery of such interactions of SCARF1 with C1q and apoptotic cells provides insight into the molecular mechanisms involved in the maintenance of tolerance and prevention of autoimmune disease.


Conflict of interest statement

COMPETING FINANCIAL INTERESTS

The authors declare no competing financial interests.

Figures
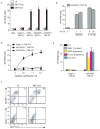
Figure 1
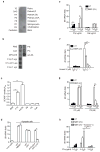
Figure 1. SCARF1 mediates recognition of apoptotic cells
a, Transfected HEK293T cells expressing mouse or human SCARF1–TNF-R1, Dectin-1–TNF-R1, or CED-1–TNF-R1 were untreated (UT) or treated with live or UV irradiated apoptotic MEFs at 1:1 ratio for 3 hours. RNA was extracted and human Il8 mRNA measured by qPCR. b, Human SCARF1–TNF-R1, human SCARF2–TNF-R1, and Dectin-1–TNF-R1 reporter cells were treated with UV-irradiated apoptotic MEFs at apoptotic cell to reporter cell ratios of 0:1, 1:5, 1:1, and 5:1 for 3 hours. Reporter cell activity was measured as in a. c, HEK293T reporter cells expressing mSCARF1–TNF-R1 or Dectin-1–TNF-R1 were treated with a 1:1 ratio of dye-labeled apoptotic UV-MEFs for 3 hours. Capture of dye-labeled apoptotic MEFs by the reporter cells was quantified by flow cytometry and analyzed using FlowJo software. d, MEFs were UV-irradiated and allowed to rest in culture for 1, 3, 8, and 24 hours. Early apoptotic cells (1 and 3 hour post-UV exposure) were Annexin V positive and propidium iodide negative, while cells undergoing secondary necrosis (8 and 24 hour post-UV exposure) stained positive for both as assessed by flow cytometry (not shown). Mouse SCARF1–TNF-R1 reporter cells were treated with a 1:1 ratio of early apoptotic cells or necrotic cells for 3 hours and Il8 expression measured as above. e, Apoptotic cells were generated by exposure to UV, Cesium-137 γ-irradiation (30 Gy), or hypotonic buffers. mSCARF1–TNF-R1 and Dectin-1–TNF-R1 reporter cells were treated with a 1:1 ratio of apoptotic Cesium-irradiated (Cs-Rad) MEFs, hypotonic MEFs, hypotonic primary B cells, and UV-irradiated DCs for 3 hours, measured as in a. All data shown are from one representative experiment of at least three performed and error bars denote the means and s.d. of at least triplicate measurements. *P<0.001; Student’s t-test.
Figure 2
Figure 2. SCARF1 binds C1q
a, Dot blot representing the binding capacity of SCARF1 to triglycerides (TG), diacylglycerol (DAG), phosphatidic acid (PA), PS, phosphatidylethanolamine (PE), phosphatidylcholine (PC), phosphatidylglycerol (PG), cardiolipin, phosphatidylin (PtdIns), ptdlns(4)P, ptdlns(4,5)P2, ptdlns(3,4,5)P3, cholesterol, sphingomyelin or 3-sulfogalactosylceramide. Representative dot blot of three independent experiments performed. b, Dot blot representing binding of SCARF1 to immobilized Calr, MFG-E8, C1q, PS, PC or acLDL. c, Binding of SCARF1 to BSA, C1q, PS, PC, Calr and acLDL as measured by ELISA. d, HEK293T cells expressing mouse SCARF1–TNF-R1 were incubated with live cells from C57BL/6 mice, apoptotic B cells from Mfge8+/+ or Mfge8−/− mice, apoptotic Calr+/+ or Calr−/− MEFs, and apoptotic wild-type MEFs transduced with shRNAs targeting GFP (shControl) or C1q (shC1q #1) for 3 hours. Knockdown efficiency was confirmed by measuring abundance of C1q mRNA in transduced MEFs by qPCR (Supplementary Fig. 2c). RNA was extracted and Il8 mRNA expression was measured by qPCR. e–h, HEK293T expressing mouse SCARF1–TNF-R1 were incubated with recombinant C1q, Calr, Annexin V or liposomes containing PC or PS at indicated concentrations. Treated cells were then incubated with UV-apoptotic MEFs for 3 hours, RNA was extracted and the levels of Il8 mRNA were measured by qPCR. Data presented represent one experiment of at least three performed and error bars represent the means and s.d. of triplicate samples. *P<0.001, **P <0.0001; Student’s t-test.
Figure 3
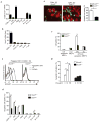
Figure 3. Impaired apoptotic cell engulfment by SCARF1-deficient CD8α+ DCs cells
a, b, qPCR analyses. RNA was obtained from CD8α+ DCs, macrophages, endothelial cells, B cells, T cells (spleen), neutrophils (bone marrow), B1a and B1b cells (peritoneum) isolated from Scarf1+/+ mice in the presence or absence of Scarf1−/− apoptotic B cells and analyzed for expression of SCARF1 by qPCR. Copies of Scarf1 mRNA were normalized to copies of B2m. Bars denote means and s.d. of three independent experiments performed with triplicate measurements. c, Splenic DCs from Scarf1+/+ and Scarf1−/− mice were co-cultured in vitro with apoptotic Scarf1−/− B cells for 4 hours and either stained with fluorescent-conjugated antibodies to SCARF1 or isotype control and examined by flow cytometry to measure surface expression. d, Cells isolated from Scarf1+/+ and Scarf1−/− mice were incubated with dye-labeled apoptotic MEFs for 2 hour at 37°C. Cells were harvested and samples were analyzed by flow cytometry (n=8 mice per group). e, CD11c+CD8α+ DCs (red) were isolated from spleens of Scarf1+/+ and Scarf1−/− mice by magnetic selection and incubated with dye-labeled apoptotic B cells (green) for 2 hours before visualization by confocal microscopy; % of DCs that phagocytose apoptotic cells was determined by counting 5 random high powered views per slide (n=8 slides). f, Apoptotic or live MEFs were labeled with the pH-sensitive dye pHrodo and incubated with CD8α+ DCs for 2 hours at 4°C or 37°C. Cells were then harvested and stained for CD11c and CD8α and mean fluorescence intensity (MFI) for each sample was determined by flow cytometry. g, Splenic CD8α+ DCs isolated from Scarf1+/+ and Scarf1−/− mice were co-cultured in C1q-depleted serum with dye-labeled apoptotic UV-MEFs in the presence or absence of exogenous C1q for 2 hours at 37°C. Uptake was measured by flow cytometry. Data presented represent one experiment of at least three performed and error bars represent the means and s.d. of triplicate samples. *P<0.01, **P <0.001; Student’s t-test.
Figure 4
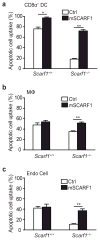
Figure 4. SCARF1 is necessary for apoptotic cell uptake
a, b, c, Splenic CD8α+ DCs, macrophages, or endothelial cells isolated from Scarf1+/+ and Scarf1−/− mice were nucleofected with a vector encoding for mSCARF1-GFP (C-terminal GFP fusion) or GFP alone. SCARF1 and control transfected cells were treated with dye-labeled apoptotic MEFs for 2 hours at 37°C. Cells were harvested, and uptake of apoptotic cells by GFP-positive cells was analyzed by flow cytometry. SCARF1 expression was confirmed by GFP expression using flow cytometry, immunoblot, and microscopy (not shown). All data shown are from one representative experiment of at least three performed and error bars denote the mean and s.d. of triplicate measurements. *P<0.01, **P <0.001; Student’s t-test.
Figure 5
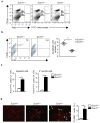
Figure 5. SCARF1 is necessary for the homeostatic clearance of apoptotic cells in vivo
a, b, Groups of six mice were injected intravenously with PBS, FITC-latex beads (0.2 mL of a 0.27% solution), or apoptotic B cells (20 × 106 CFSE-labeled). One hour later spleens were harvested and splenocytes stained for CD11c and CD8α, and samples analyzed by flow cytometry. Panels of dot plots show DCs pre-gated for CD11c expression and analyzed for CD8α and CFSE fluorescent stain. b, Graphical representation of apoptotic B cell uptake by CD11c+CD8α+ splenic DCs (n=5 mice per group). c, Whole blood from >16 week-old Scarf1+/+ and Scarf1−/− mice was collected and PBMCs were isolated by Ficoll gradient. PBMCs were stained with Annexin V and propidium iodide and analyzed by flow cytometry. Graphs depict the total number of circulating apoptotic or secondary necrotic cells per mL of blood and represent the average of 3 independent experiments (n=8 mice per group). d, Apoptotic cells in spleen sections from >16 week-old Scarf1+/+ and Scarf1−/− mice were stained with TUNEL (green) and CD11c (red) and analyzed by fluorescent microscopy. TUNEL quantification was determined by analyzing images with a DAPI-TUNEL staining automated analysis macro for ImageJ software. Pictures and graph are representative of 3 independent experiments (4 mice per group). *P<0.001, **P <0.0001; Student’s t-test.
Figure 6
Figure 6. Autoantibody generation in Scarf1−/− mice
a, ANA immunofluorescence was performed using HEp-2 cells, with sera from 20-week old Scarf1+/+ and Scarf1−/− mice (25 male and 25 female mice per group). b, Serum ANAs were classified as either nuclear homogenous, nuclear speckled, or cytoplasmic staining patterns. None detected (ND). c, Percentage of male and female Scarf1−/− mice staining positive (>1:320 dilution) for ANA. Staining was scored by an observer blinded to the genotype of the mice. **P <0.0001; Student’s t-test. d, Anti-nucleosome (dsDNA-histone) autoantibodies in the serum of Scarf1+/+ and Scarf1−/− male and female mice were determined by ELISA (n=14 mice per group). Bars represent median values with s.d. **P<0.0001; Mann-Whitney test. e, Crithidia luciliae immunofluorescence was performed with serum from Scarf1−/− male and female mice at 1:80 dilution (n=14 mice per group). *P<0.001, **P <0.0001; Student’s t-test. f, Anti-Smith-RNP autoantibodies in the serum of Scarf1+/+ and Scarf1−/− male and female mice were determined by ELISA (n=14 mice per group).
Figure 7
Figure 7. Increased immune activation in Scarf1−/− mice
a, Incidence and severity of skin disease in Scarf1−/− mice (analyzed mice: 47 total, 22 female and 25 male). b, Cryosections of skin from 20 week-old Scarf1+/+ and Scarf1−/− female mice were stained for H&E, for TUNEL (green) to detect apoptotic cells and nuclear stain DAPI (blue), and analyzed by fluorescent microscopy. TUNEL quantification was determined by analyzing images with a DAPI-TUNEL staining automated analysis macro for ImageJ software (8 mice per group). c, Average weights of harvested spleens from Scarf1+/+ and Scarf1−/− mice at 8 and 20 weeks of age. Bars denote the means and s.d. of measurements (n=8 mice per group) P<0.01 by Student’s t-test. d, H&E stained cryosections of spleens showing enlarged germinal centers in Scarf1−/− mice (6 mice per group). e, Absolute numbers of immune cells in the spleen of Scarf1+/+ and Scarf1−/− mice determined by surface marker staining and flow cytometry analysis (6 mice per group). f, g, Absolute number of CD44+CD4+ activated T cells and follicular helper CXCR5hiBlimpBcl6+CD4+ T cells in the spleens of Scarf1+/+ and Scarf1−/− mice (6 mice per group). h, Concentration of total serum IgG in 20-week old female and male Scarf1+/+ and Scarf1−/− mice. Data represent the average of three independent experiments performed in triplicate (12 mice per group). *P<0.05, **P<0.01, ***P<0.001, Student’s t-test.
Figure 8
Figure 8. Lupus nephritis in Scarf1−/− mice
a, Cryosections of kidneys from 24 week-old Scarf1+/+ and Scarf1−/− female mice were fixed with 4% paraformaldehyde and stained with periodic acid-Schiff (PAS, 12 mice per group). b, Deposition of immune complexes in glomeruli. Cryosections of kidneys from 24 week-old Scarf1+/+ and Scarf1−/− female mice were stained with AlexaFluor 488-conjugated antibody to mouse IgG (green) and nuclear stain DAPI (blue), and analyzed by fluorescent microscopy. c, Incidence and severity of renal disease in Scarf1−/− mice (24 mice per group). d, e, f, Scarf1+/+ and Scarf1−/− mice were placed in a metabolic chamber for 24 hours and the urine collected was analyzed for proteinuria, percentage of blood, and leukocytes in the urine of mice were determined by Roche Chemstrip 5OB for urinalysis (12 mice per group). g, Blood urea nitrogen levels in Scarf1+/+ and Scarf1−/− mice. Data represent average of three independent experiments (n=10 mice), error bars denote the means and s.d. of at least triplicate measurements. None detected (ND). *P<0.01, ** P<0.001; Student’s t test.

Comment in

Similar articles

Cited by

References

    1. Elliott MR, Ravichandran KS. Clearance of apoptotic cells: implications in health and disease. J Cell Biol. 2010;189:1059–1070. - PMC - PubMed
    1. Devitt A, Marshall LJ. The innate immune system and the clearance of apoptotic cells. J Leukoc Biol. 2011;90:447–457. - PubMed
    1. Lauber K, Blumenthal SG, Waibel M, Wesselborg S. Clearance of apoptotic cells: getting rid of the corpses. Mol Cell. 2004;14:277–287. - PubMed
    1. Erwig LP, Henson PM. Clearance of apoptotic cells by phagocytes. Cell death and differentiation. 2008;15:243–250. - PubMed
    1. Munoz LE, et al. Apoptosis in the pathogenesis of systemic lupus erythematosus. Lupus. 2008;17:371–375. - PubMed

Publication types

MeSH terms