. 2013 Oct;79(19):5978-87.
doi: 10.1128/AEM.01727-13. Epub 2013 Jul 26.

New methods for analysis of spatial distribution and coaggregation of microbial populations in complex biofilms

Affiliations

New methods for analysis of spatial distribution and coaggregation of microbial populations in complex biofilms

Robert Almstrand et al. Appl Environ Microbiol. 2013 Oct.

Abstract

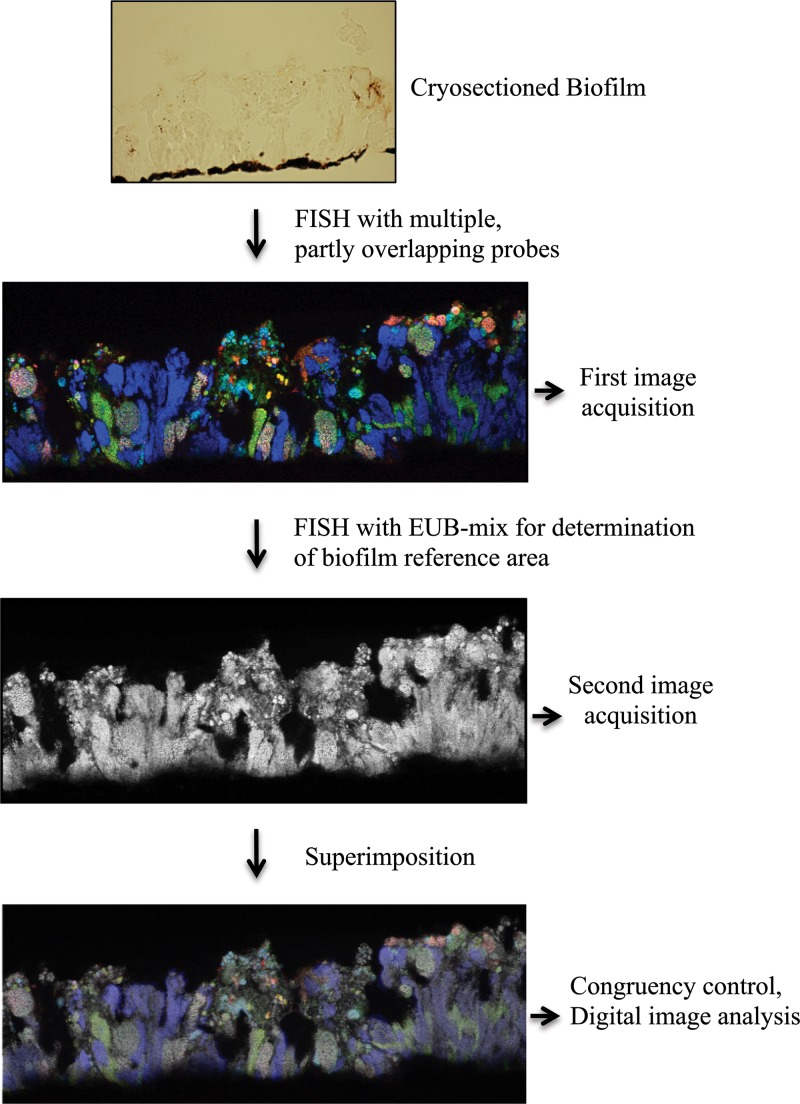
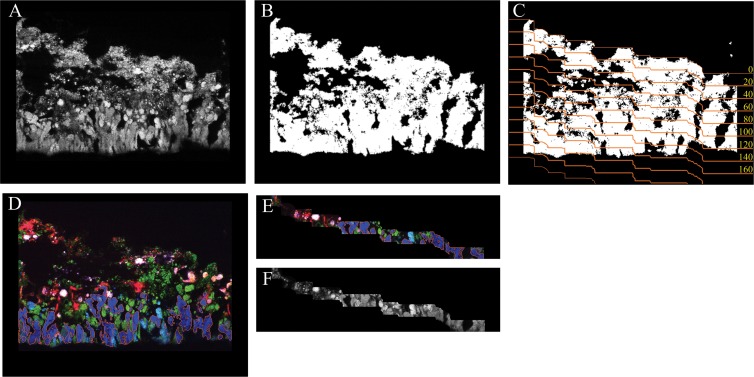
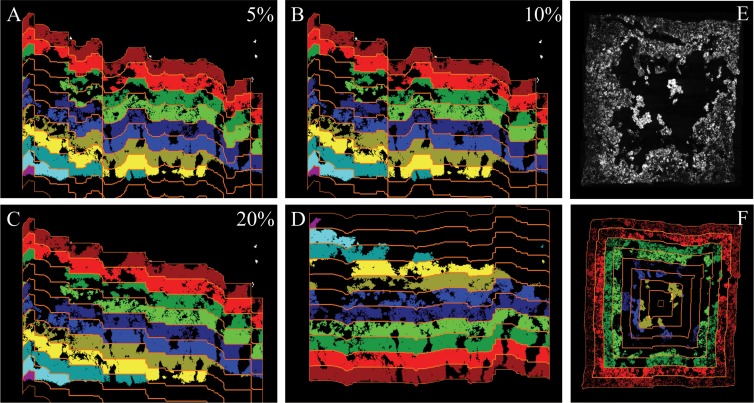
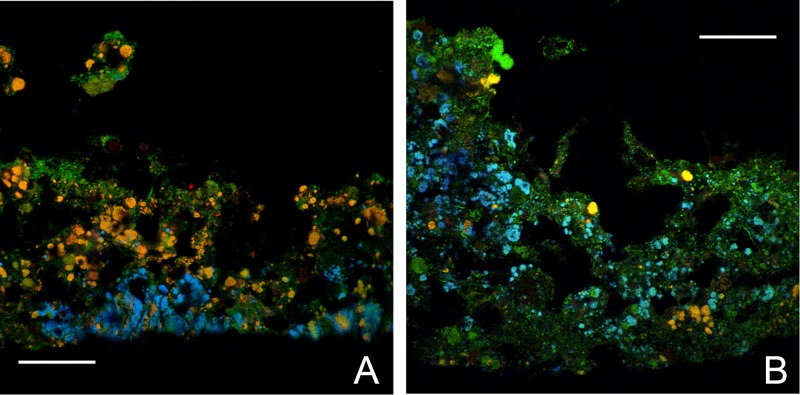
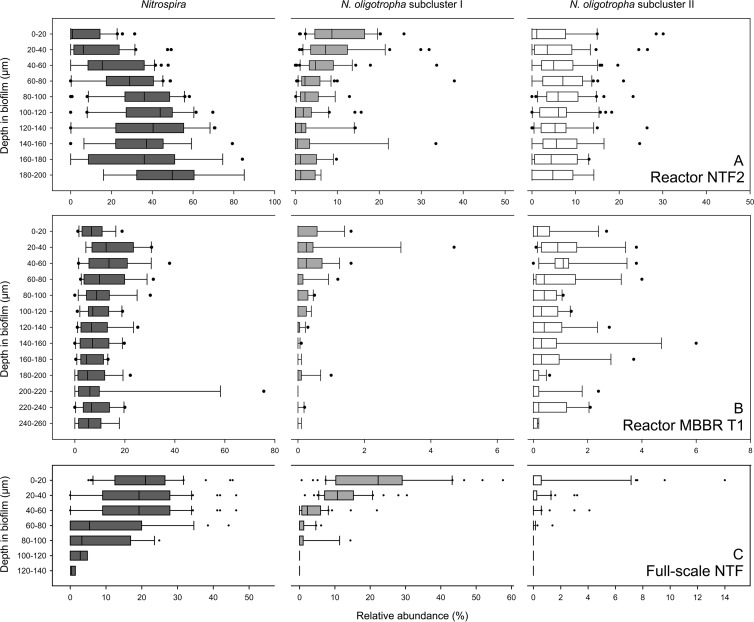
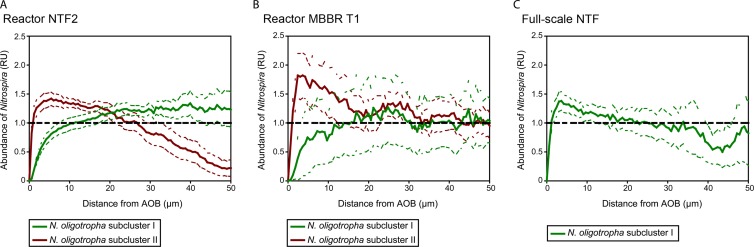
In biofilms, microbial activities form gradients of substrates and electron acceptors, creating a complex landscape of microhabitats, often resulting in structured localization of the microbial populations present. To understand the dynamic interplay between and within these populations, quantitative measurements and statistical analysis of their localization patterns within the biofilms are necessary, and adequate automated tools for such analyses are needed. We have designed and applied new methods for fluorescence in situ hybridization (FISH) and digital image analysis of directionally dependent (anisotropic) multispecies biofilms. A sequential-FISH approach allowed multiple populations to be detected in a biofilm sample. This was combined with an automated tool for vertical-distribution analysis by generating in silico biofilm slices and the recently developed Inflate algorithm for coaggregation analysis of microbial populations in anisotropic biofilms. As a proof of principle, we show distinct stratification patterns of the ammonia oxidizers Nitrosomonas oligotropha subclusters I and II and the nitrite oxidizer Nitrospira sublineage I in three different types of wastewater biofilms, suggesting niche differentiation between the N. oligotropha subclusters, which could explain their coexistence in the same biofilms. Coaggregation analysis showed that N. oligotropha subcluster II aggregated closer to Nitrospira than did N. oligotropha subcluster I in a pilot plant nitrifying trickling filter (NTF) and a moving-bed biofilm reactor (MBBR), but not in a full-scale NTF, indicating important ecophysiological differences between these phylogenetically closely related subclusters. By using high-resolution quantitative methods applicable to any multispecies biofilm in general, the ecological interactions of these complex ecosystems can be understood in more detail.


Figures

Fig 1
Fig 1
The sequential-FISH procedure. The first FISH was performed with multiple partly overlapping probes targeting NOB, AOB, or Betaproteobacteria. In a second iteration, the same biofilm was subjected to FISH with the EUB338 probe mixture. After each round of FISH, CLSM images of the same microscope FOVs were acquired at the same positions. The images were aligned and superimposed in silico. For illustrative purposes, the brightness and contrast of the multicolor FISH images were increased. The pixel intensities and contrast in the original images were lower but sufficient for image segmentation and analysis.
Fig 2
Fig 2
Automated slicing of biofilm images. (A) Greyscale image of cryosectioned biofilm labeled by FISH with the EUB338 probe mixture. (B) The same image as in panel A after binarization and the removal of noise and small particles. (C) The same image as in panel A after binarization and with the edges of the automatically defined slices (orange lines), which have a thickness of 20 μm in this example. The yellow numbers indicate the depth (in μm) starting at the top surface line of the biofilm. (D) The same biofilm region with different nitrifiers labeled by FISH with specific probes. The orange borders around the biomass of Nitrospira-like NOB (dark blue) indicate that this population has been identified by image segmentation. (E) A subimage of panel D after automatic slicing as defined for panel C. The slice shown represents the zone at 100 to 120 μm. Note that the segmentation of the Nitrospira biomass has been preserved (the orange borders are still present). (F) A subimage of panel A after automatic slicing as defined for panel C. The slice shown represents the zone at 100 to 120 μm. Together, the images in panels E and F can be used for quantifying the biovolume fraction of Nitrospira in this region of the biofilm.
Fig 3
Fig 3
Effects of different algorithm parameters on the automatic slicing of biofilm images. (A to C) The same biofilm image sliced with 5, 10, or 20% smoothing of the surface line. The slicing direction is from top to bottom. The slices are colorized for illustrational purposes. (D) The same biofilm image as in panels A to C but sliced from bottom to top (with 20% surface line smoothing). (E) Image of biofilm grown on all four walls of a hollow plastic carrier. (F) Application of the multidirectional-slicing algorithm on the biofilm in panel E. The biofilm image is sliced simultaneously in four directions.
Fig 4
Fig 4
Images exemplifying biofilm structure and stratification. Cryosectioned biofilms from the pilot plant NTF2 (A) and MBBR T1 (B) show cells hybridized with the AOB probe mixture and the EUB338 probe mixtures (yellow), Nitrospira cells hybridized with probe Ntspa662 and the EUB338 probe mixture (cyan), and other bacteria hybridized with the EUB338 probe mixture only (green). Scale bars = 60 μm.
Fig 5
Fig 5
Vertical-distribution analysis of Nitrospira (dark-gray boxes), N. oligotropha subcluster I (light-gray boxes), and N. oligotropha subcluster II (white boxes) from NTF2 (A), MBBR T1 (B), and the full-scale NTF (C). Relative proportions as percentages of the total bacterial community, as determined by the EUB338 probe mixture, are shown as box plots for each population at the different depths in the corresponding biofilms. Note the differences in scales on the x and y axes. The boundary of the box closest to zero indicates the 25th percentile, a line within the box marks the median, and the boundary of the box farthest from zero indicates the 75th percentile. The whiskers left and right of the box indicate the 90th and 10th percentiles. The solid circles are outlying points.
Fig 6
Fig 6
Coaggregation analysis of Nitrospira and AOB in biofilms from three systems. The mean abundance of Nitrospira relative to the abundance that would be expected if the nitrifiers were randomly distributed is plotted against the distance from the biomass of AOB. A value of 1.0 (horizontal dashed lines) indicates random distribution at the respective distance, whereas larger values indicate coaggregation of Nitrospira with AOB. Values smaller than 1.0 indicate that the abundance of Nitrospira was below the abundance of a randomly distributed organism. The colored dashed lines indicate 95% confidence intervals. RU, relative units. According to the terminology (20), the y axis shows the normalized positional pixel fraction of Nitrospira. A 95% confidence interval above or below the normalized y axis indicates coaggregation or repulsion, respectively. (A) Results obtained for biofilm from reactor NTF2. (B) The same analysis for reactor MBBR T1. (C) Results for the full-scale NTF. Here, AOB of subcluster II were not analyzed due to their low abundance.

Similar articles

Cited by

References

    1. Branda SS, Vik S, Friedman L, Kolter R. 2005. Biofilms: the matrix revisited. Trends Microbiol. 13:20–26 - PubMed
    1. Nickel JC, Ruseska I, Wright JB, Costerton JW. 1985. Tobramycin resistance of Pseudomonas aeruginosa cells growing as biofilm on urinary catheter material. Antimicrob. Agents Chemother. 27:619–624 - PMC - PubMed
    1. Matz C, Kjelleberg S. 2005. Off the hook: how bacteria survive protozoan grazing. Trends Microbiol. 13:302–307 - PubMed
    1. Lawrence JR, Korber DR, Hoyle BD, Costerton JW, Caldwell DE. 1991. Optical sectioning of microbial biofilms. J. Bacteriol. 173:6558–6567 - PMC - PubMed
    1. de Beer D, Stoodley P, Roe F, Lewandowski Z. 1994. Effects of biofilm structures on oxygen distribution and mass transport. Biotechnol. Bioeng. 43:1131–1138 - PubMed

Publication types

MeSH terms