. 2013 Aug 29;500(7464):593-7.
doi: 10.1038/nature12364. Epub 2013 Jul 28.

Genetic programs in human and mouse early embryos revealed by single-cell RNA sequencing

Affiliations

Genetic programs in human and mouse early embryos revealed by single-cell RNA sequencing

Zhigang Xue et al. Nature. .

Abstract

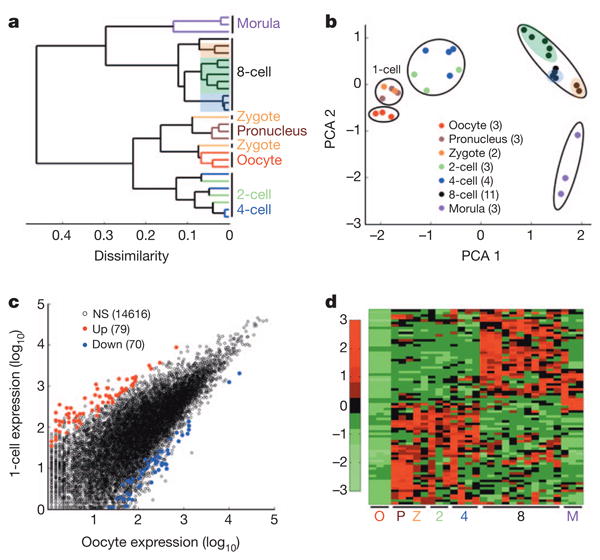
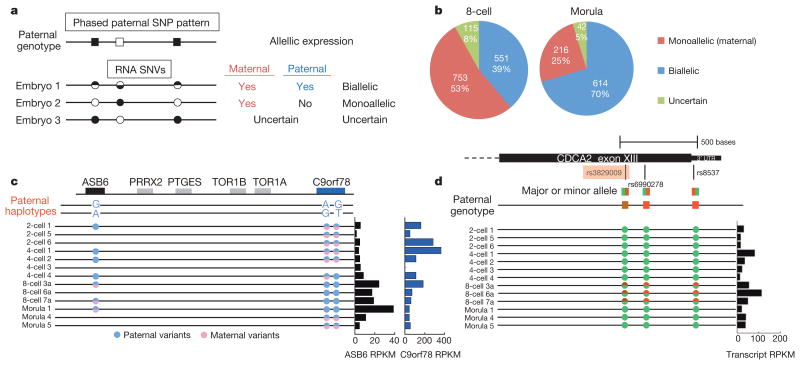
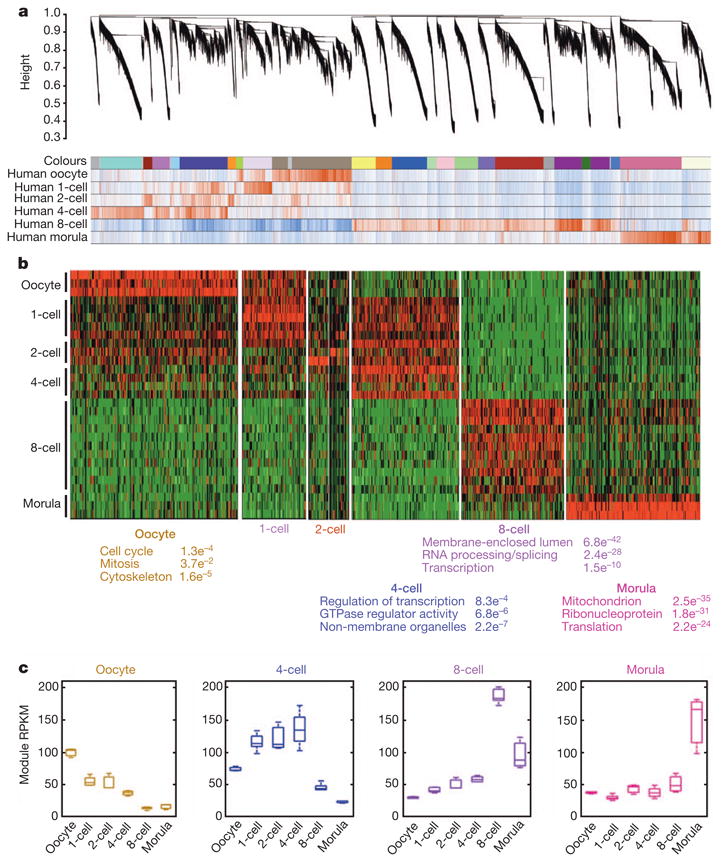
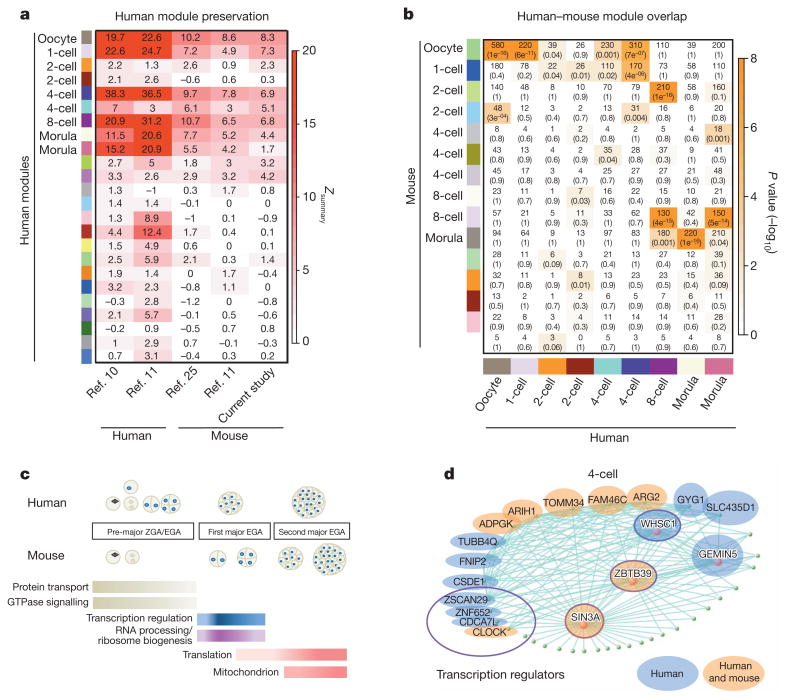
Mammalian pre-implantation development is a complex process involving dramatic changes in the transcriptional architecture. We report here a comprehensive analysis of transcriptome dynamics from oocyte to morula in both human and mouse embryos, using single-cell RNA sequencing. Based on single-nucleotide variants in human blastomere messenger RNAs and paternal-specific single-nucleotide polymorphisms, we identify novel stage-specific monoallelic expression patterns for a significant portion of polymorphic gene transcripts (25 to 53%). By weighted gene co-expression network analysis, we find that each developmental stage can be delineated concisely by a small number of functional modules of co-expressed genes. This result indicates a sequential order of transcriptional changes in pathways of cell cycle, gene regulation, translation and metabolism, acting in a step-wise fashion from cleavage to morula. Cross-species comparisons with mouse pre-implantation embryos reveal that the majority of human stage-specific modules (7 out of 9) are notably preserved, but developmental specificity and timing differ between human and mouse. Furthermore, we identify conserved key members (or hub genes) of the human and mouse networks. These genes represent novel candidates that are likely to be key in driving mammalian pre-implantation development. Together, the results provide a valuable resource to dissect gene regulatory mechanisms underlying progressive development of early mammalian embryos.


Figures

Figure 1
Figure 1. High-resolution single-cell transcriptome analysis of human pre-implantation embryos
a, Unsupervised hierarchical clustering. b, Principal component analysis of single blastomere expression patterns for seven stages of oocytes and pre-implantation embryos. Sister cells from the same 8-cell embryo are highlighted together. The number of samples for each stage are indicated in the PCA legend in parenthesis as well as in Supplementary Table 1. c, Scatterplot showing the number of activated (red) and reduced (blue) genes in 1-cell embryos (n = 5) compared to oocytes (n = 3). d, Heatmap showing relative expression patterns of 1-cell activated genes (n = 79) across all pre-implantation stages. NS, not significant.
Figure 2
Figure 2. Tracing parent-of-origin allelic RNA transcripts through SNV analysis in pre-implantation embryos
a, Schematic for deducing maternal and paternal transcript origin from the presence or absence of homozygous paternal alleles. Embryo number 3 has unclear contribution from the maternal allele. b, Pie charts showing the number and per cent of all gene transcripts exhibiting single-nucleotide variants (SNVs) and their assignments into one of three categories as illustrated in a. c, Example of maternal activation and degradation from a deduced partial haplotype. d, Example of paternal activation by comparing embryos that showed biallelic expression in one stage but monoallelic (maternal) expression in a previous stage. rs3829009 is highlighted because the minor alleleisanArg884Ser missense variant. SNPs are adenine (green), guanine (red) and thymine (brown).
Figure 3
Figure 3. Network analysis of human pre-implantation development
a, Hierarchical cluster tree showing co-expression modules identified using WGCNA. Modules correspond to branches and are labelled by colours as indicated by the first colour band underneath the tree. Remaining colour bands reveal highly correlated (red) or anti-correlated (blue) transcripts for the particular stage. b, Heatmap showing relative expression of 7,313 genes in 7 representative stage-specific modules across all samples. As each developmental window only has one or two highly correlated modules, the modules were assigned biological names. Top three representative gene ontology terms and their associated functional enrichment P values are shown below. c, Boxplots showing the distribution of module expression (mean RPKM of all genes within a given module) for different cell types.
Figure 4
Figure 4. Stage-specific gene activation is preserved in human and mouse pre-implantation development
a, Heatmap of human module preservation scores in available independent data sets labelled on the x axis. b, Heatmap showing the significance of gene overlaps between independently constructed human and mouse modules. The x axis shows only human stage-specific modules (n = 9) and the y axis shows all mouse modules (n = 15). Each cell contains the number of intersecting genes and P value of the intersection. Colour legend represents −log10 P value based on the hypergeometric test. c, Schematic drawing of the sequential transcriptome switches of four major pathways in human and mouse pre-implantation embryos. Gene lists for gene ontology terms are derived from human and mouse stage-specific modules with significant overlap (P < 10−4) as shown in b. d, Module visualization of network connections and associated function. Highly connected intramodular hub genes are indicated by a red dot and independently validated hub genes are highlighted in blue (for human only) and orange (for both human and mouse). Data in part a are from refs 10, 11 and 25.

References

    1. Niakan KK, Han J, Pedersen RA, Simon C, Pera RA. Human pre-implantation embryo development. Development. 2012;139:829–841. - PMC - PubMed
    1. Hamatani T, Carter MG, Sharov AA, Ko MS. Dynamics of global gene expression changes during mouse preimplantation development. Dev Cell. 2004;6:117–131. - PubMed
    1. Wang QT, et al. A genome-wide study of gene activity reveals developmental signaling pathways in the preimplantation mouse embryo. Dev Cell. 2004;6:133–144. - PubMed
    1. Zeng F, Baldwin DA, Schultz RM. Transcript profiling during preimplantation mouse development. Dev Biol. 2004;272:483–496. - PubMed
    1. Langfelder P, Horvath S. WGCNA: an R package for weighted correlation network analysis. BMC Bioinformatics. 2008;9:559. - PMC - PubMed

Publication types