. 2013 Sep 5;501(7465):121-4.
doi: 10.1038/nature12395. Epub 2013 Jul 28.

Recovery from slow inactivation in K+ channels is controlled by water molecules

Affiliations

Recovery from slow inactivation in K+ channels is controlled by water molecules

Jared Ostmeyer et al. Nature. .

Abstract

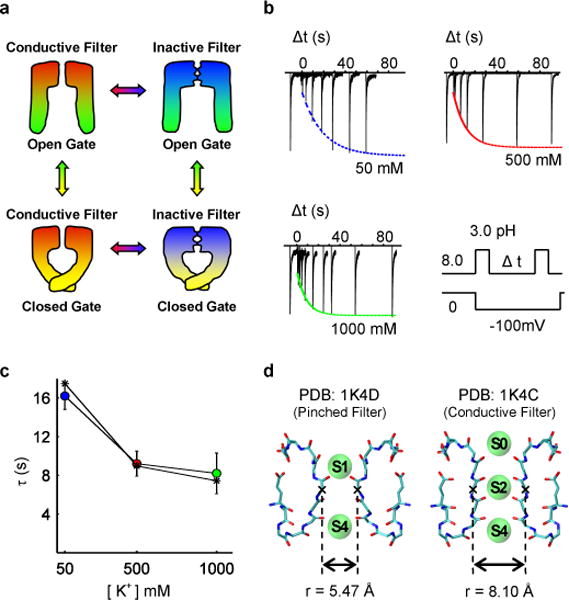
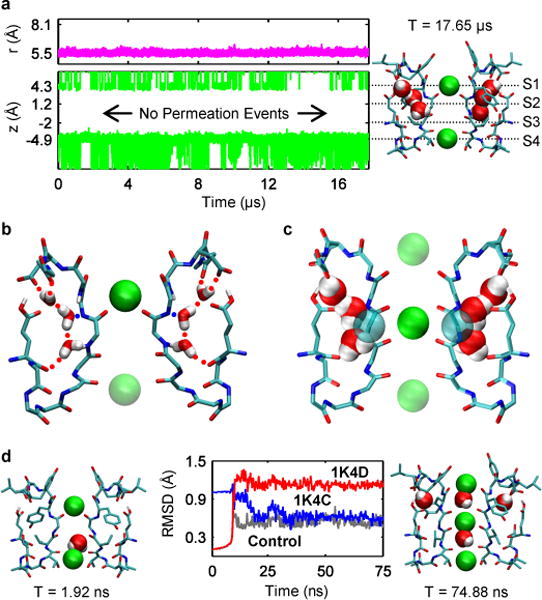
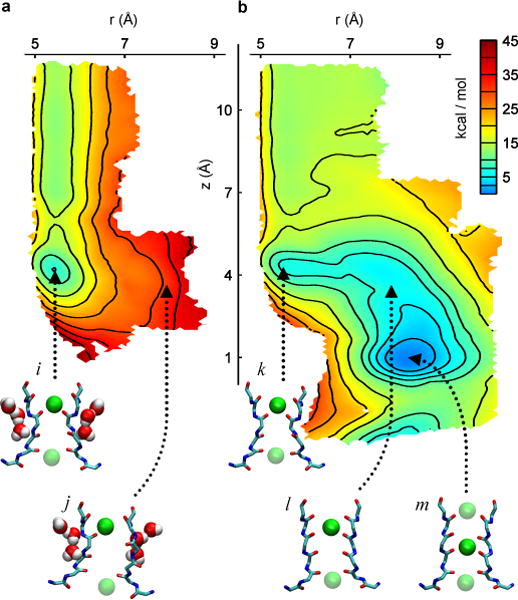
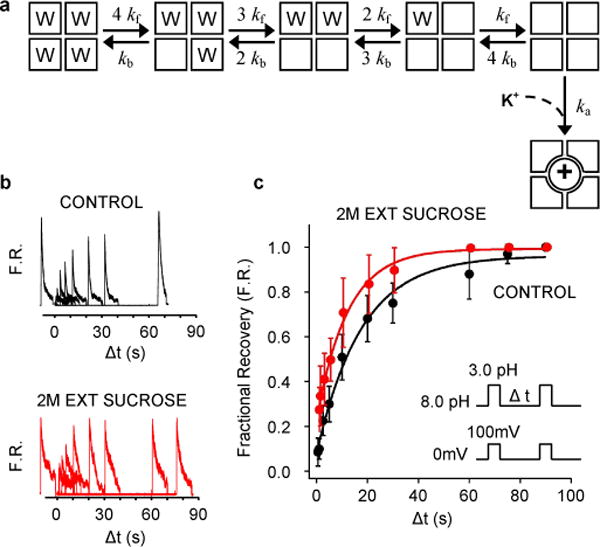
Application of a specific stimulus opens the intracellular gate of a K(+) channel (activation), yielding a transient period of ion conduction until the selectivity filter spontaneously undergoes a conformational change towards a non-conductive state (inactivation). Removal of the stimulus closes the gate and allows the selectivity filter to interconvert back to its conductive conformation (recovery). Given that the structural differences between the conductive and inactivated filter are very small, it is unclear why the recovery process can take up to several seconds. The bacterial K(+) channel KcsA from Streptomyces lividans can be used to help elucidate questions about channel inactivation and recovery at the atomic level. Although KcsA contains only a pore domain, without voltage-sensing machinery, it has the structural elements necessary for ion conduction, activation and inactivation. Here we reveal, by means of a series of long molecular dynamics simulations, how the selectivity filter is sterically locked in the inactive conformation by buried water molecules bound behind the selectivity filter. Potential of mean force calculations show how the recovery process is affected by the buried water molecules and the rebinding of an external K(+) ion. A kinetic model deduced from the simulations shows how releasing the buried water molecules can stretch the timescale of recovery to seconds. This leads to the prediction that reducing the occupancy of the buried water molecules by imposing a high osmotic stress should accelerate the rate of recovery, which was verified experimentally by measuring the recovery rate in the presence of a 2-molar sucrose concentration.


Figures

Figure 1
Figure 1. Gating, inactivation and recovery in KcsA channels
(a) Schematic depiction of the four dominant functional states. (b) Recovery of the selectivity filter from slow-inactivation measured from inward K+ current during a double pulse protocol that cycles the intracellular gate from open (inactivating the filter) to closed (promoting filter recovery) to open (for measuring the extent of recovery). The fraction of recovered channels increases as a function the inter-pulse duration (Δt) in each of the 3 patches, and may be fit to a single exponential function. (c) The fit time constants for recovery for various symmetric K+ concentrations demonstrate that K+ accelerates recovery. Results based on a kinetic model are shown as dashed line with asterisks. (d) The conductive state of the selectivity filter compared to the pinched state is characterized by a relatively small increase in the minimum inter-subunit distance between backbone atoms of the filter and an increase in ion occupancy.
Figure 2
Figure 2. MD simulations reveal mechanism of recovery from inactivation
(a) Results from a simulation of the pinched filter show the width of the filter remained near r = 5.5Å where r is defined as the cross-subunit distance between the Cα atoms of glycine 77 (magenta line, top plot). Plot of the height of K+ ions, z, above the center of mass of the selectivity filter (green traces, bottom plot). Projection of the aforementioned plot onto a snapshot of the selectivity filter at the end of the simulation (right). (b) Network of hydrogen bonds match each water with two donors and an acceptor keeping waters trapped behind the selectivity filter throughout the simulation. (c) Water positions behind the pinched filter of 1K4D sterically clash with the conductive filter 1K4C. Rendering both water positions from 1K4D and the Cα glycine atoms from 1K4C as van der Waals spheres reveals that unfavorable steric clashes of ~1 Å in magnitude would exists between the protein and waters. (d) In simulations without water behind the filter, the RMS distance of the pinched filter relative to its original crystallographic coordinates (red) increases as the RMS distance to the conductive filter in 1K4C (blue) decreases. The RMS distance versus 1K4C falls to ~0.6 Å, comparable with a control simulation (dark grey) starting from the conductive filter 1K4C.
Figure 3
Figure 3. 2D free energy landscape of the recovery process
The horizontal reaction coordinate r describes the width of the selectivity filter and is defined as the cross-subunit distance between the Cα atoms of glycine 77. The vertical reaction coordinate z is the height of a K+ ion relative to the center of mass of the selectivity filter. (a) PMF calculated with inactivating waters present behind the selectivity filter. The pinched filter rests in a free energy minimum with a K+ in position S1 (snapshot i). The transition from a pinched to a conductive conformation (snapshot j) of the selectivity filter is impeded by a ~25 kcal/mol free energy barrier relative to the local minimum, resulting in an unstable conformation of the conductive filter. (b) PMF calculated with the inactivating waters absent. The pinched filter with a K+ ion in position S1 (snapshot k) recovers spontaneously, following the downhill slope of the free energy landscape. The filter recovers to a conductive conformation by moving first to an open conformation (snapshot l) before ions in the filter adopt a conductive configuration (snapshot m).
Figure 4
Figure 4. Role of water molecules in recovery process
(a) Kinetic scheme incorporating the main findings of the MD simulations. The model was used to produce the simulated recovery times as function of [K+] shown in Figure 1c (dashed line) using the rate constants are 1/kf=11μs, 1/kb=79ns, 1/ka=8.3 ns × (150mM/[K+]). When starting the kinetic model in the state with no inactivating waters, the channel reaches the active conductive state rather than the fully inactive state with a probability of ~0.5 at 50 mM of [K+]. This probability rises to ~0.7 at 150 mM of [K+]. (b and c) Effect of external sucrose on the time-course of recovery. (b) Outward currents recorded with external 5K+/145 mM NMG and internal 150 mM K+ in the absence and presence of 2M external sucrose. (c) Fractional recovery (F.R.) from 8 patches plotted as a function of the inter-pulse interval.

References

    1. Cordero-Morales JF, Cuello LG, Zhao YX, Jogini V, Cortes DM, Roux B, Perozo E. Molecular determinants of gating at the potassium-channel selectivity filter. Nature Structural & Molecular Biology. 2006;13:311–318. - PubMed
    1. Chakrapani S, Cordero-Morales JF, Perozo E. A quantitative description of KcsA gating II: single-channel currents. J Gen Physiol. 2007;130:479–496. 2151667. - PMC - PubMed
    1. Chakrapani S, Cordero-Morales JF, Perozo E. A quantitative description of KcsA gating I: macroscopic currents. J Gen Physiol. 2007;130:465–478. 2151670. - PMC - PubMed
    1. Cordero-Morales JF, Jogini V, Lewis A, Vasquez V, Cortes DM, Roux B, Perozo E. Molecular driving forces determining potassium channel slow inactivation. Nature Structure and Molecular Biology. 2007;14:1062–1069. - PubMed
    1. Imai S, Osawa M, Takeuchi K, Shimada I. Structural basis underlying the dual gate properties of KcsA. Proc Natl Acad Sci U S A. 2010;107:6216–6221. 2852003. - PMC - PubMed

Publication types