. 2013 Sep 13;288(37):26914-25.
doi: 10.1074/jbc.M113.495119. Epub 2013 Jul 26.

Trypanosome Letm1 protein is essential for mitochondrial potassium homeostasis

Affiliations

Trypanosome Letm1 protein is essential for mitochondrial potassium homeostasis

Hassan Hashimi et al. J Biol Chem. .

Abstract

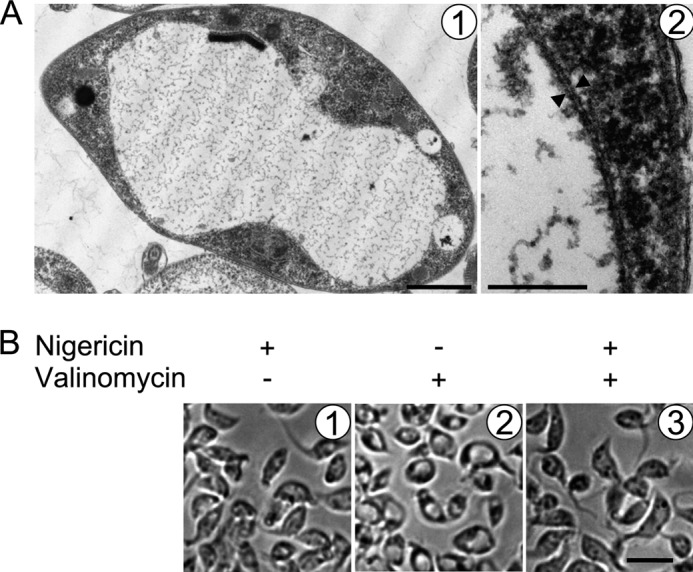
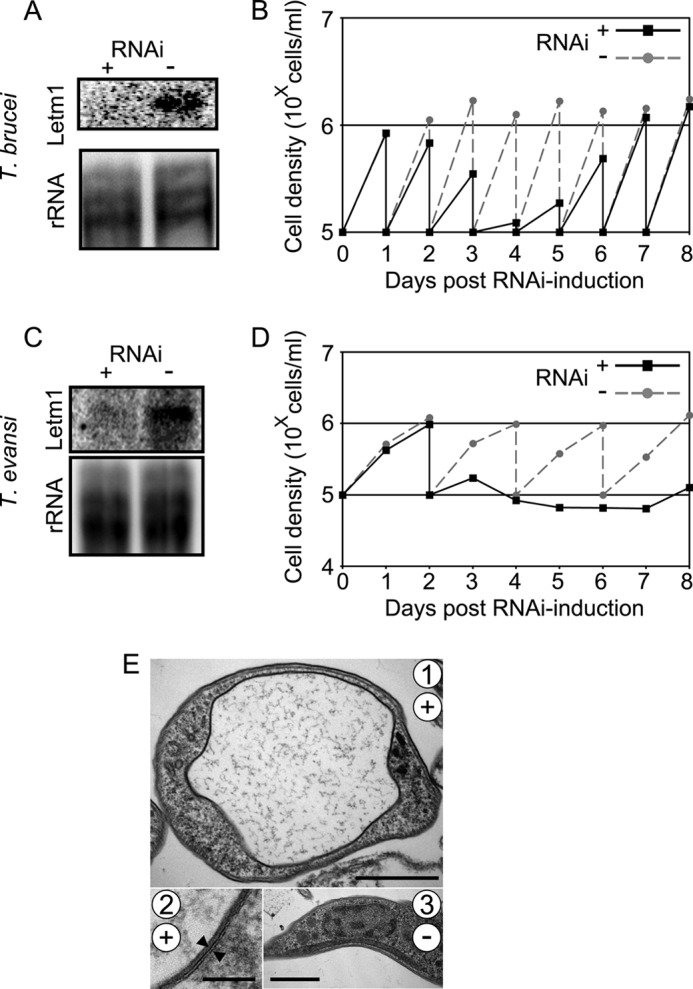
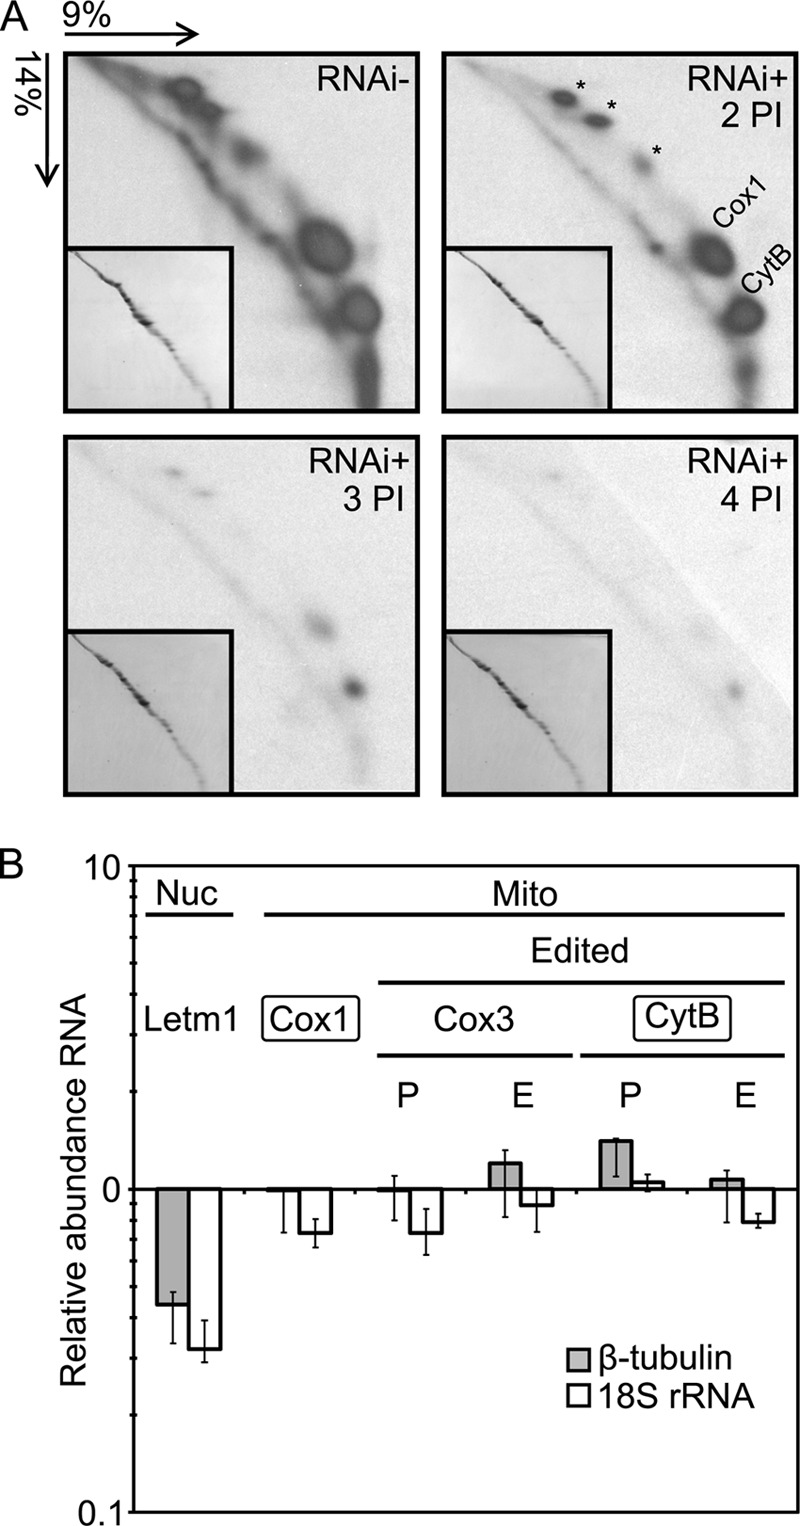
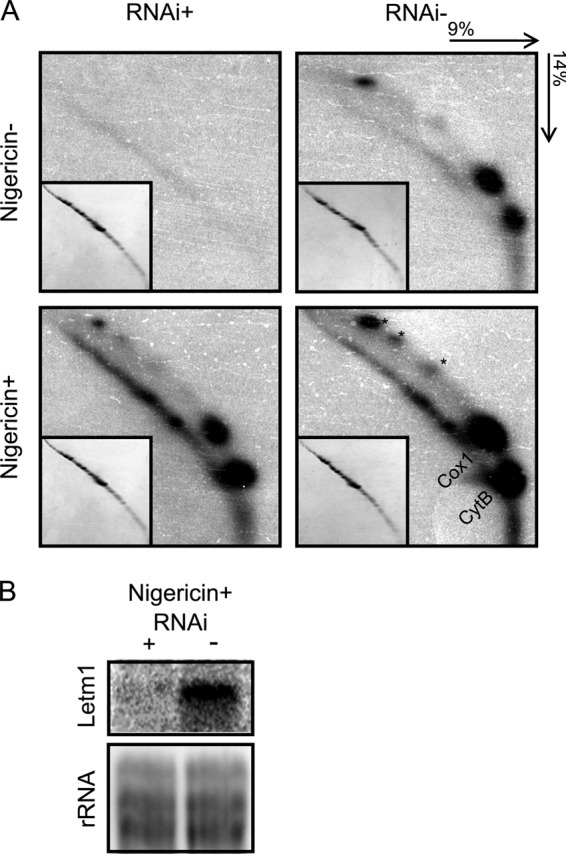
Letm1 is a conserved protein in eukaryotes bearing energized mitochondria. Hemizygous deletion of its gene has been implicated in symptoms of the human disease Wolf-Hirschhorn syndrome. Studies almost exclusively performed in opisthokonts have attributed several roles to Letm1, including maintaining mitochondrial morphology, mediating either calcium or potassium/proton antiport, and facilitating mitochondrial translation. We address the ancestral function of Letm1 in the highly diverged protist and significant pathogen, Trypanosoma brucei. We demonstrate that Letm1 is involved in maintaining mitochondrial volume via potassium/proton exchange across the inner membrane. This role is essential in the vector-dwelling procyclic and mammal-infecting bloodstream stages as well as in Trypanosoma brucei evansi, a form of the latter stage lacking an organellar genome. In the pathogenic bloodstream stage, the mitochondrion consumes ATP to maintain an energized state, whereas that of T. brucei evansi also lacks a conventional proton-driven membrane potential. Thus, Letm1 performs its function in different physiological states, suggesting that ion homeostasis is among the few characterized essential pathways of the mitochondrion at this T. brucei life stage. Interestingly, Letm1 depletion in the procyclic stage can be complemented by exogenous expression of its human counterpart, highlighting the conservation of protein function between highly divergent species. Furthermore, although mitochondrial translation is affected upon Letm1 ablation, it is an indirect consequence of K(+) accumulation in the matrix.

Keywords: Bioenergetics; Letm1; Mitochondria; Potassium Transport; Translation; Trypanosome.


Figures

FIGURE 1.
FIGURE 1.
Localization of C-terminally YFP-tagged Letm1 to T. brucei mitochondrial inner membrane. A, indirect immunofluorescence of fixed PS T. brucei labeled with MitoTracker Red, which visualizes the single reticulated organelle. Labels above pictures indicate signal from YFP antibody (YFP), MitoTracker (Mito), and both (Merge) and signals overlaid with a differential contrast image (Merge-DIC). DAPI-stained nucleus (n) and kDNA (k) are indicated by an arrowhead and arrow, respectively. Scale bar, 2 μm. B, Western blot analysis of digitonin fractionation of cytoplasm (Cyto) and mitochondrial (Mito) compartments in comparison with an equivalent amount of lysate from whole cells (Total). The 75 kDa marker is indicated on the right. C, Western blot analysis of Triton X-114 fractionation of mitochondrial proteins into membrane and soluble fractions, which reside in the detergent (Det.) or aqueous (Aq.) phases, respectively. D, Western blot analysis of SMPs treated with proteinase K (+) or untreated controls (−). Antibodies used are indicated on the left.
FIGURE 2.
FIGURE 2.
Knockdown of Letm1 in PS T. brucei results in growth inhibition and mitochondrial swelling. A, Northern blot analysis showing that Letm1 mRNA is depleted in cells grown with the RNAi-inducing tetracycline (+) as compared with the untreated controls (−) in the upper image (Letm1). The ethidium bromide-stained rRNA from the corresponding lanes is shown below as a loading control. B, PS T. brucei grown in the presence (RNAi+) or absence (RNAi−) of tetracycline. The x axis shows days post-RNAi induction; the y axis shows cell density in 10X cells/ml plotted on a logarithmic scale. C, transmission electron micrographs of cells grown in the presence (+; pictures 1 and 2) or absence (−; picture 3) of tetracycline for 3 days. Cristae and double membranes are indicated by arrows and double arrowheads, respectively. Scale bars, 1 μm, 100 nm, and 500 nm for pictures 1, 2, and 3, respectively.
FIGURE 3.
FIGURE 3.
Expression of human Letm1 rescues knockdown of the T. brucei ortholog. A and B, indirect immunofluorescence and digitonin subfractionation of PS T. brucei confirm mitochondrial localization of the C-terminal HA3-tagged human Letm1 (HA). Other labels and the scale bar in A are as described for Fig. 1, A and B. C, Northern blot analysis confirms the ablation of the endogenous T. brucei Letm1 mRNA in cells constitutively overexpressing exogenous human Letm1. Labeling is as in Fig. 2A. D, growth of PS T. brucei constitutively overexpressing human Letm1 grown in the presence (RNAi+) or absence (RNAi−) of tetracycline. Labeling is as in Fig. 2B. E, alignment of the predicted transmembrane domain of the human and T. brucei orthologs. *, conserved predicted protein kinase C phosphorylation site; red line, transmembrane domain. The E-value of BLAST alignment of the two sequences is shown at the bottom.
FIGURE 4.
FIGURE 4.
Treatment with the ionophore nigericin rescues the Letm1 knockdown in PS T. brucei. A, cell growth in a 0–100 nm range of nigericin concentrations (x axis), as measured by density (10x cells/ml, along the y axis) of cells grown in the presence (RNAi+) or absence of tetracycline (RNAi−). Each shaded line represents 1–3 days after treatment. n = 4; error bars indicate S.D. B, cell growth in a 0–100 ng/ml range of monensin concentrations (x axis); otherwise as in A. C, light micrographs showing cells after 3 days of RNAi induction either treated with 25 nm nigericin (+) or mock-treated with ethanol (−). Scale bar, 10 μm. D, flow cytometry histogram following membrane potential in MitoTracker-labeled PC T. brucei grown in the presence (RNAi+) or absence of tetracycline (RNAi−) and either mock-treated with ethanol (top plot; −) or treated with 25 nm nigericin (bottom plot; +). An increase in fluorescence is depicted on the x axis from left to right on a logarithmic scale plotted against a cell count on the y axis. Unfilled curves are measurements of cells also treated with 20 μm carbonyl cyanide p-trifluoromethoxyphenylhydrazone (FCCP), an uncoupler of mitochondrial membrane potential.
FIGURE 5.
FIGURE 5.
Treatment of PS T. brucei with the K+ ionophore valinomycin results in mitochondrial swelling. A, transmission electron micrographs of PS T. brucei treated with a 1 μm concentration of the K+ ionophore valinomycin. Double membranes are indicated by opposing arrowheads. Scale bars, 2 μm and 200 nm for pictures 1 and 2, respectively. Note the peripherally located kinetoplast DNA disk. B, light micrographs showing cells treated with either 2 μm nigericin or 1 μm valinomycin alone or pretreated with the former and then treated with the latter, as indicated at the top of the images from left to right. Scale bar, 10 μm.
FIGURE 6.
FIGURE 6.
Knockdown of Letm1 in BS T. brucei and T. brucei evansi results in growth inhibition and mitochondrial swelling. A–D, Northern blot analysis confirming ablation of Letm1 mRNA in RNAi-induced cells versus non-induced controls plus growth analysis comparing these two samples in BS T. brucei (A and B) and T. brucei evansi (C and D). Labeling is as in Fig. 2, A and B. E, transmission electron micrographs of T. brucei evansi grown in the presence (+; pictures 1 and 2) or absence (−; picture 3) of tetracycline for 3 days. Double membranes are indicated by opposing arrowheads. Scale bars, 1 μm, 100 nm, and 1 μm for pictures 1, 2, and 3, respectively.
FIGURE 7.
FIGURE 7.
Knockdown of Letm1 has an effect on mitochondrial translation in PS T. brucei. A, resolution of de novo [35S]methionine-labeled mitochondrial proteins by two-dimensional SDS-PAGE. Acrylamide composition and the direction of each dimension are indicated at the top left. Insets show the same gels in which the cytoplasmic proteins are Coomassie-stained. Gels are RNAi− and RNA+ 2, 3, and 4 days postinduction (PI) by tetracycline. The identified spots corresponding to apocytochrome b (CytB) and cytochrome c oxidase subunit 1 (Cox1) are indicated along with hitherto unidentified mitochondrial proteins (*). B, quantitative real-time PCR assaying steady state levels of selected mitochondrial (Mito) and nucleus-encoded Letm1 mRNAs (Nuc). Transcripts undergoing RNA editing are indicated, and the pre-edited (P) and edited (E) forms were individually assayed. Boxed transcripts are those whose protein products were followed in A. The mean relative levels of the assayed amplicons in the RNAi-induced cells relative to the levels in the uninduced control are plotted logarithmically and normalized to the same calculation performed for the nucleus-encoded β-tubulin (gray bars) and 18 S rRNA cDNAs (white bars), which were unaffected by the Letm1 RNAi silencing. Error bars, range of obtained relative abundances; n = 3.
FIGURE 8.
FIGURE 8.
Mitochondrial translation persists in nigericin-treated PS T. brucei Letm1 knockdowns. A, resolution of de novo [35S]methionine-labeled mitochondrial proteins by two-dimensional SDS-PAGE. Acrylamide composition and the direction of each dimension are indicated at the top right. Other labels and features are as described for Fig. 7A. Gels corresponding to protein products from RNAi-induced cells (RNAi+) and uninduced controls (RNAi−) are indicated at the top, and those treated with 25 μm nigericin (Nigericin+) and untreated (Nigericin−) are designated on the left. B, Northern blot analysis showing that Letm1 mRNA is down-regulated in cells grown in the presence of tetracycline (+) as compared with the untreated controls (−), both grown in the presence of nigericin. Labeling is as in Fig. 2A.

Similar articles

Cited by

References

    1. Nowikovsky K., Froschauer E. M., Zsurka G., Samaj J., Reipert S., Kolisek M., Wiesenberger G., Schweyen R. J. (2004) The LETM1/YOL027 gene family encodes a factor of the mitochondrial K+ homeostasis with a potential role in the Wolf-Hirschhorn syndrome. J. Biol. Chem. 279, 30307–30315 - PubMed
    1. Schlickum S., Moghekar A., Simpson J. C., Steglich C., O'Brien R. J., Winterpacht A., Endele S. U. (2004) LETM1, a gene deleted in Wolf-Hirschhorn syndrome, encodes an evolutionarily conserved mitochondrial protein. Genomics 83, 254–261 - PubMed
    1. Dimmer K. S., Navoni F., Casarin A., Trevisson E., Endele S., Winterpacht A., Salviati L., Scorrano L. (2008) LETM1, deleted in Wolf-Hirschhorn syndrome is required for normal mitochondrial morphology and cellular viability. Hum. Mol. Genet. 17, 201–214 - PubMed
    1. Frazier A. E., Taylor R. D., Mick D. U., Warscheid B., Stoepel N., Meyer H. E., Ryan M. T., Guiard B., Rehling P. (2006) Mdm38 interacts with ribosomes and is a component of the mitochondrial protein export machinery. J. Cell Biol. 172, 553–564 - PMC - PubMed
    1. Endele S., Fuhry M., Pak S. J., Zabel B. U., Winterpacht A. (1999) LETM1, a novel gene encoding a putative EF-hand Ca2+-binding protein, flanks the Wolf-Hirschhorn syndrome (WHS) critical region and is deleted in most WHS patients. Genomics 60, 218–225 - PubMed

Publication types

MeSH terms