

Time-dependent gene expression analysis of the developing superior olivary complex
- PMID: 23893414
- PMCID: PMC3764792
- DOI: 10.1074/jbc.M113.490508
Time-dependent gene expression analysis of the developing superior olivary complex
Abstract
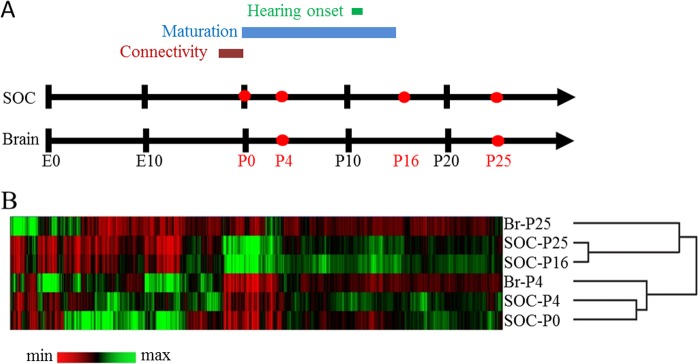
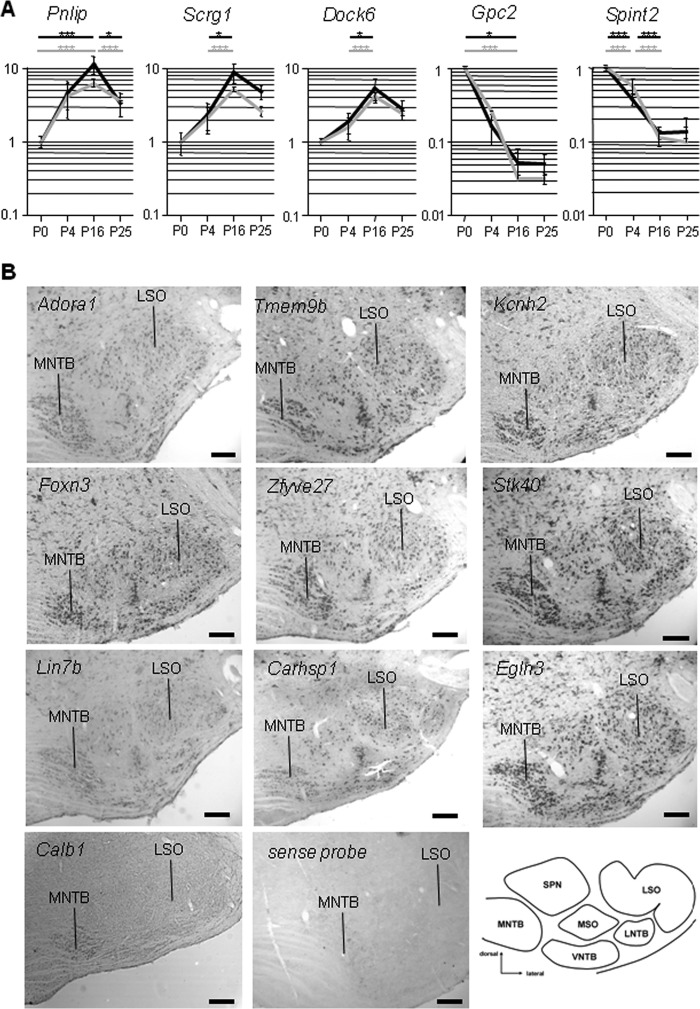
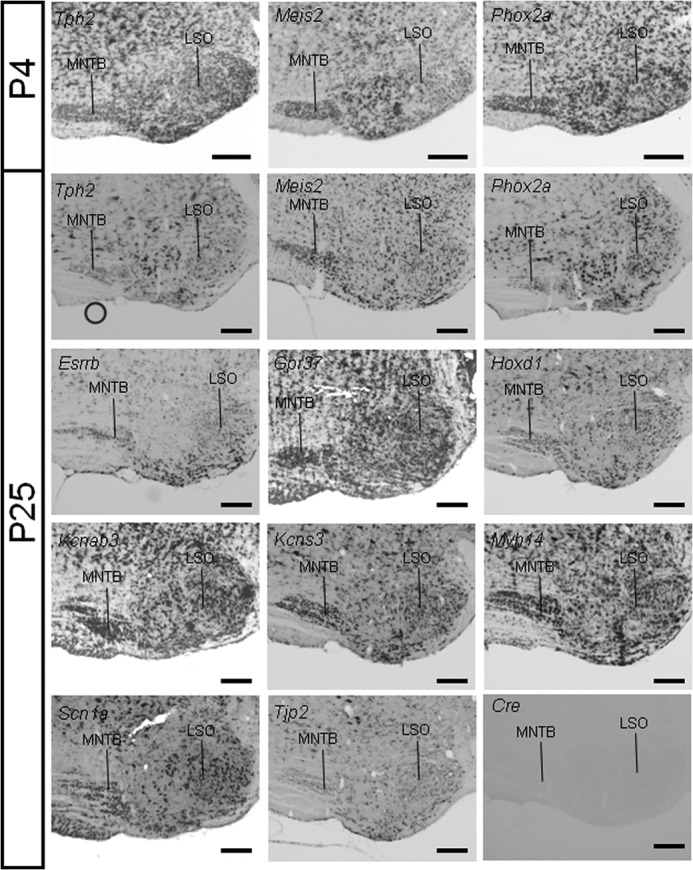
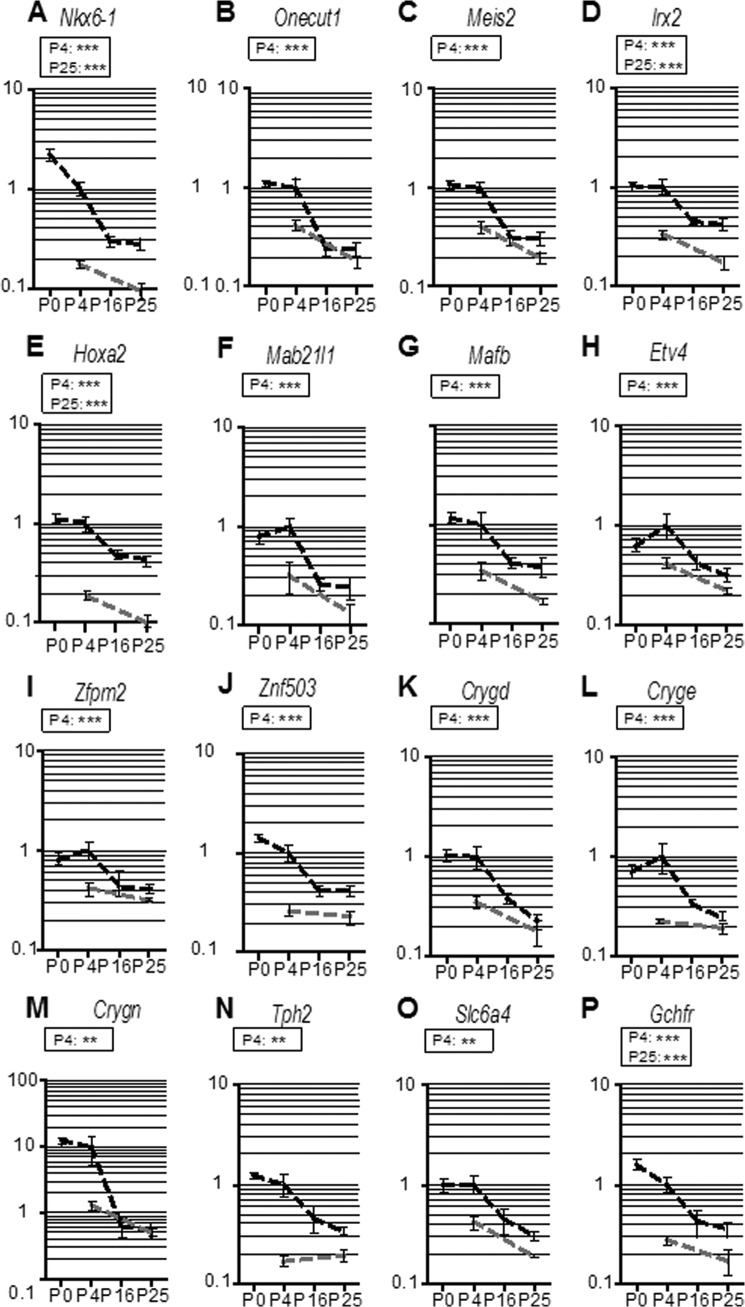
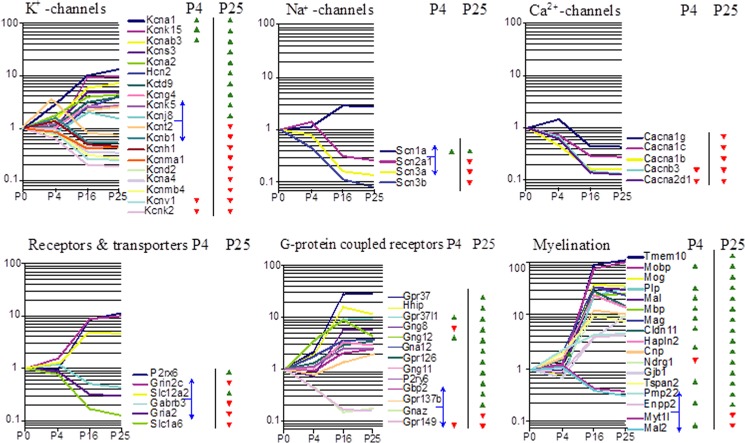
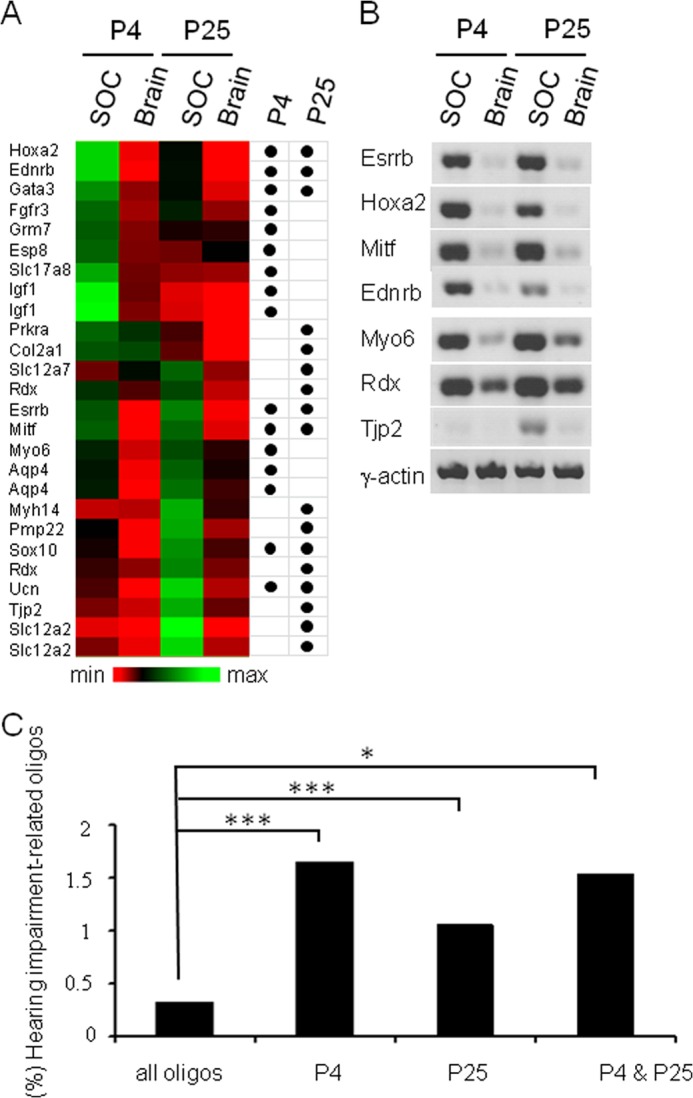
The superior olivary complex (SOC) is an essential auditory brainstem relay involved in sound localization. To identify the genetic program underlying its maturation, we profiled the rat SOC transcriptome at postnatal days 0, 4, 16, and 25 (P0, P4, P16, and P25, respectively), using genome-wide microarrays (41,012 oligonucleotides (oligos)). Differences in gene expression between two consecutive stages were highest between P4 and P16 (3.6%) and dropped to 0.06% between P16 and P25. To identify SOC-related genetic programs, we also profiled the entire brain at P4 and P25. The number of differentially expressed oligonucleotides between SOC and brain almost doubled from P4 to P25 (4.4% versus 7.6%). These data demonstrate considerable molecular specification around hearing onset, which is rapidly finalized. Prior to hearing onset, several transcription factors associated with the peripheral auditory system were up-regulated, probably coordinating the development of the auditory system. Additionally, crystallin-γ subunits and serotonin-related genes were highly expressed. The molecular repertoire of mature neurons was sculpted by SOC-related up- and down-regulation of voltage-gated channels and G-proteins. Comparison with the brain revealed a significant enrichment of hearing impairment-related oligos in the SOC (26 in the SOC, only 11 in the brain). Furthermore, 29 of 453 SOC-related oligos mapped within 19 genetic intervals associated with hearing impairment. Together, we identified sequential genetic programs in the SOC, thereby pinpointing candidates that may guide its development and ensure proper function. The enrichment of hearing impairment-related genes in the SOC may have implications for restoring hearing because central auditory structures might be more severely affected than previously appreciated.
Keywords: Auditory Processing Disorder; Circuit Development; Deafness; Genetic Diseases; Neurodevelopment; Neurodifferentiation; Neuroprotection; Retrocochlear Function; Transcription Factors.
Figures
Similar articles
-
Retrocochlear function of the peripheral deafness gene Cacna1d.Hum Mol Genet. 2012 Sep 1;21(17):3896-909. doi: 10.1093/hmg/dds217. Epub 2012 Jun 7. Hum Mol Genet. 2012. PMID: 22678062
-
Glutamate-induced Co2+ uptake in rat auditory brainstem neurons reveals developmental changes in Ca2+ permeability of glutamate receptors.Eur J Neurosci. 1998 Mar;10(3):941-54. doi: 10.1046/j.1460-9568.1998.00104.x. Eur J Neurosci. 1998. PMID: 9753161
-
Localization of rat glycine receptor alpha1 and alpha2 subunit transcripts in the developing auditory brainstem.J Comp Neurol. 2001 Sep 24;438(3):336-52. J Comp Neurol. 2001. PMID: 11550176
-
Anatomy and physiology of binaural hearing.Audiology. 1991;30(3):125-34. doi: 10.3109/00206099109072878. Audiology. 1991. PMID: 1953442 Review.
-
Plasticity of the superior olivary complex.Microsc Res Tech. 2000 Nov 15;51(4):364-81. doi: 10.1002/1097-0029(20001115)51:4<364::AID-JEMT6>3.0.CO;2-E. Microsc Res Tech. 2000. PMID: 11071720 Review.
Cited by
-
Defining the relationship between maternal care behavior and sensory development in Wistar rats: Auditory periphery development, eye opening and brain gene expression.PLoS One. 2020 Aug 21;15(8):e0237933. doi: 10.1371/journal.pone.0237933. eCollection 2020. PLoS One. 2020. PMID: 32822407 Free PMC article.
-
Glial Cell Expansion Coincides with Neural Circuit Formation in the Developing Auditory Brainstem.Dev Neurobiol. 2018 Nov;78(11):1097-1116. doi: 10.1002/dneu.22633. Epub 2018 Aug 26. Dev Neurobiol. 2018. PMID: 30136399 Free PMC article.
-
Myelin development, plasticity, and pathology in the auditory system.Dev Neurobiol. 2018 Feb;78(2):80-92. doi: 10.1002/dneu.22538. Epub 2017 Sep 26. Dev Neurobiol. 2018. PMID: 28925106 Free PMC article. Review.
-
Transcriptional maturation of the mouse auditory forebrain.BMC Genomics. 2015 Aug 14;16(1):606. doi: 10.1186/s12864-015-1709-8. BMC Genomics. 2015. PMID: 26271746 Free PMC article.
-
Expression pattern of cochlear microRNAs in the mammalian auditory hindbrain.Cell Tissue Res. 2021 Feb;383(2):655-666. doi: 10.1007/s00441-020-03290-x. Epub 2020 Nov 6. Cell Tissue Res. 2021. PMID: 33156384 Free PMC article.
References
-
- Blatchley B. J., Cooper W. A., Coleman J. R. (1987) Development of auditory brainstem response to tone pip stimuli in the rat. Brain Res. 429, 75–84 - PubMed
-
- Friauf E. (2004) Developmental changes and cellular plasticity in the superior olivary complex. in Plasticity of the Auditory System (Parks T. N., Rubel E. W., Fay R. R., Popper A. N., eds) pp. 49–95, Springer, New York
-
- Friauf E., Kandler K. (1990) Auditory projections to the inferior colliculus of the rat are present by birth. Neurosci. Lett. 120, 58–61 - PubMed
Publication types
MeSH terms
Substances
Associated data
- Actions
LinkOut - more resources
Full Text Sources
Other Literature Sources
Molecular Biology Databases
