. 2013 Sep 13;288(37):26521-32.
doi: 10.1074/jbc.M113.475053. Epub 2013 Jul 26.

Covalent trapping of methyllycaconitine at the α4-α4 interface of the α4β2 nicotinic acetylcholine receptor: antagonist binding site and mode of receptor inhibition revealed

Affiliations

Covalent trapping of methyllycaconitine at the α4-α4 interface of the α4β2 nicotinic acetylcholine receptor: antagonist binding site and mode of receptor inhibition revealed

Nathan L Absalom et al. J Biol Chem. .

Abstract

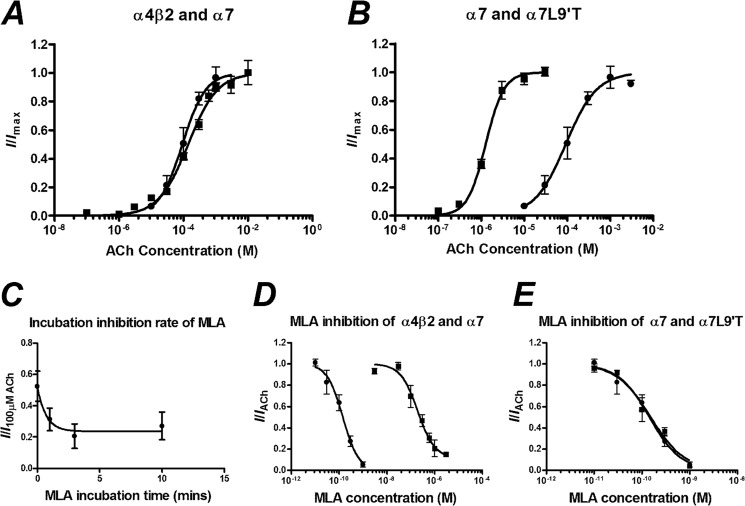
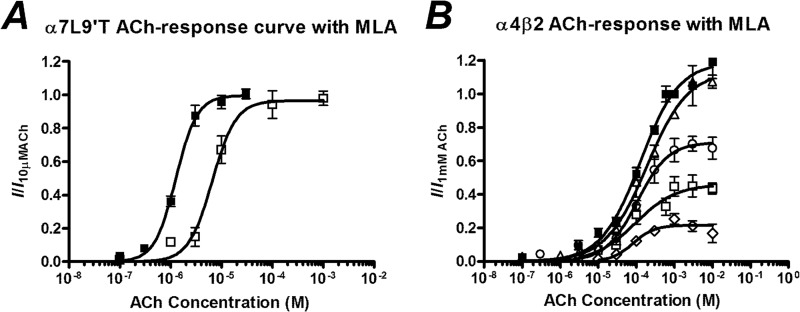
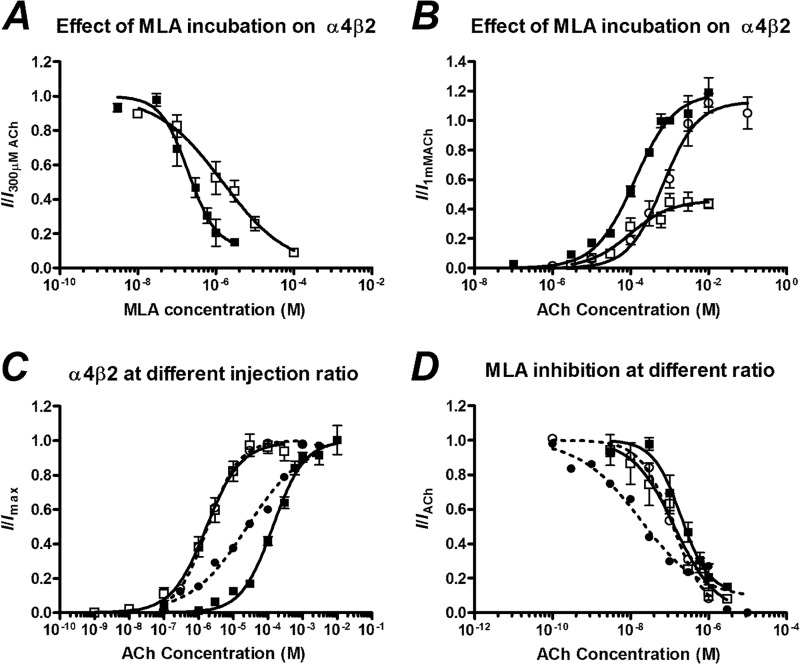
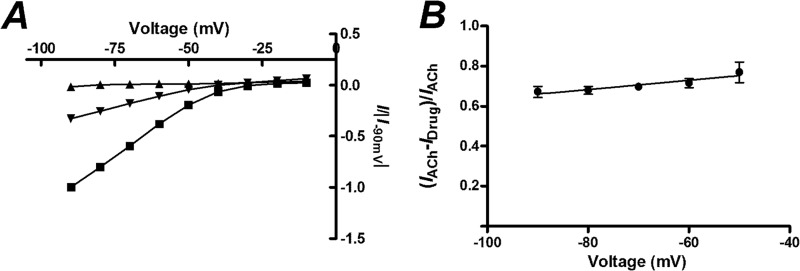
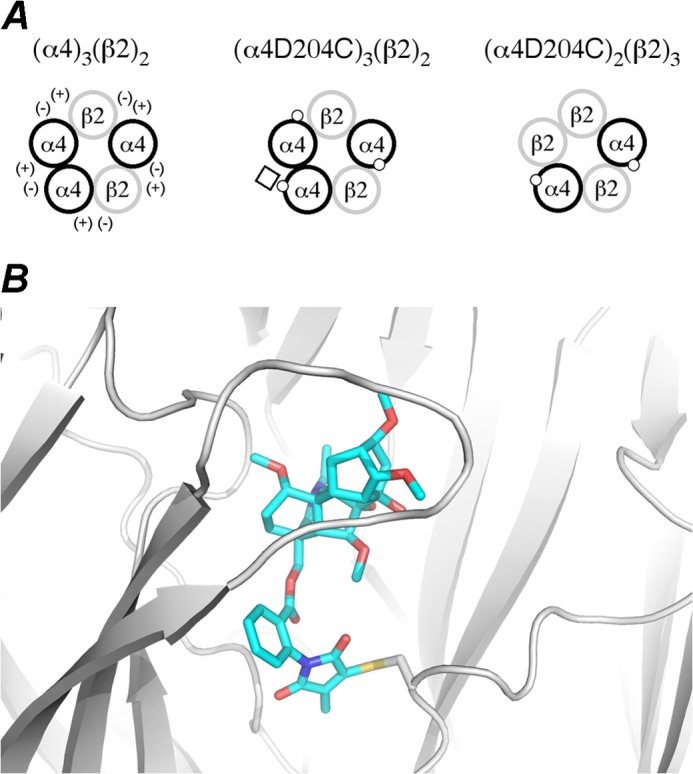
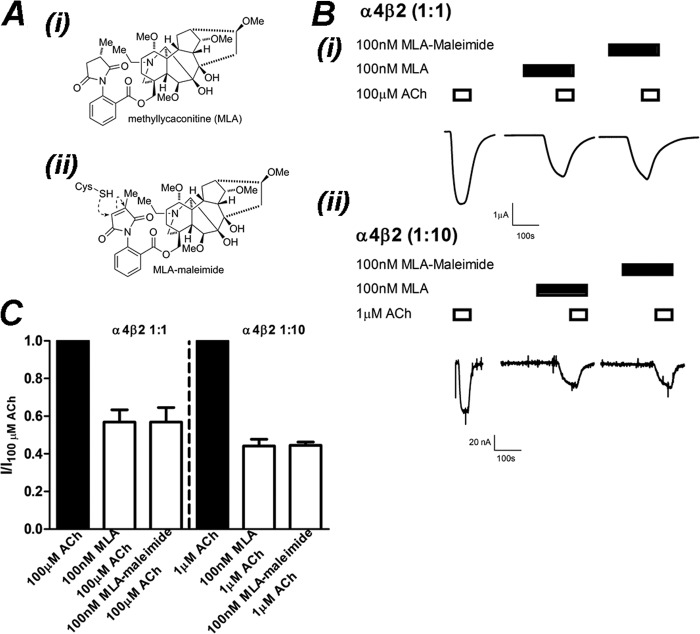
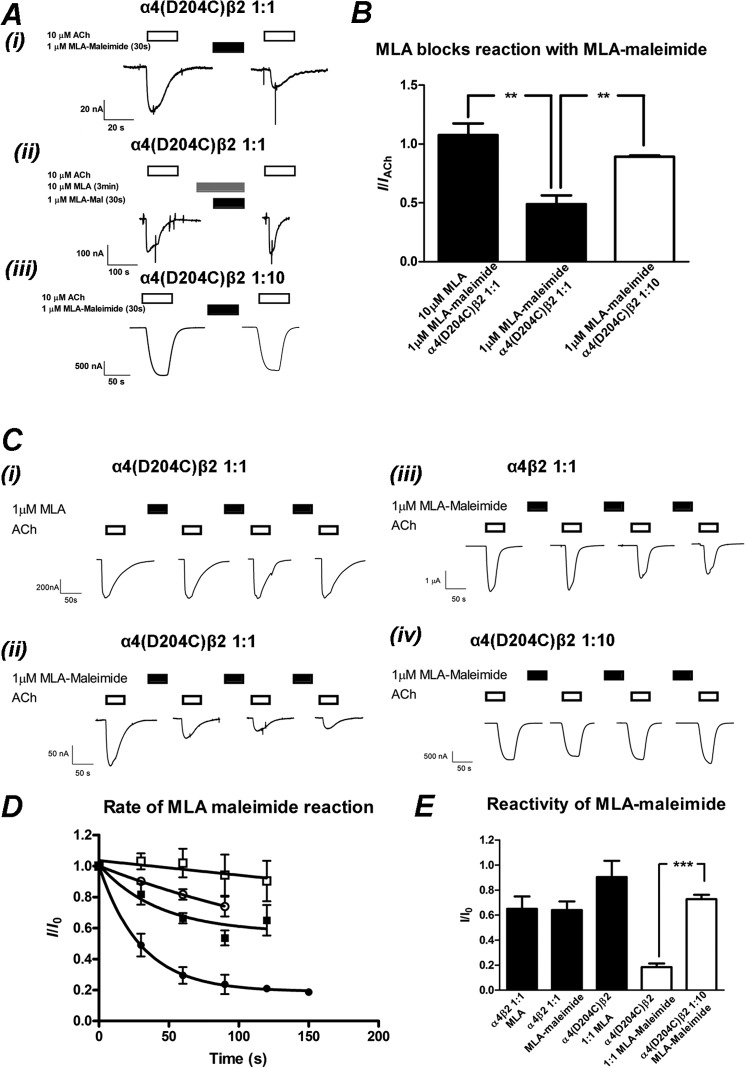
The α4β2 nicotinic acetylcholine receptors (nAChRs) are widely expressed in the brain and are implicated in a variety of physiological processes. There are two stoichiometries of the α4β2 nAChR, (α4)2(β2)3 and (α4)3(β2)2, with different sensitivities to acetylcholine (ACh), but their pharmacological profiles are not fully understood. Methyllycaconitine (MLA) is known to be an antagonist of nAChRs. Using the two-electrode voltage clamp technique and α4β2 nAChRs in the Xenopus oocyte expression system, we demonstrate that inhibition by MLA occurs via two different mechanisms; that is, a direct competitive antagonism and an apparently insurmountable mechanism that only occurs after preincubation with MLA. We hypothesized an additional MLA binding site in the α4-α4 interface that is unique to this stoichiometry. To prove this, we covalently trapped a cysteine-reactive MLA analog at an α4β2 receptor containing an α4(D204C) mutation predicted by homology modeling to be within reach of the reactive probe. We demonstrate that covalent trapping results in irreversible reduction of ACh-elicited currents in the (α4)3(β2)2 stoichiometry, indicating that MLA binds to the α4-α4 interface of the (α4)3(β2)2 and providing direct evidence of ligand binding to the α4-α4 interface. Consistent with other studies, we propose that the α4-α4 interface is a structural target for potential therapeutics that modulate (α4)3(β2)2 nAChRs.

Keywords: Cys-loop Receptors; Cysteine Trapping; Homology Modeling; Molecular Pharmacology; Nicotinic Acetylcholine Receptors; Receptor Inhibition; Receptor Structure-Function.


Figures

FIGURE 1.
FIGURE 1.
A, concentration-response curves to ACh of oocytes injected with a 1:1 ratio of α4β2 (■) and α7 (●) nAChR mRNA are shown. B, concentration-response curves for ACh against oocytes injected with α7(L9′T) (■) and α7 (●) nAChR mRNA are shown. C, inhibition of 100 μm ACh with 1 μm MLA incubated for various time periods before co-application of 100 μm ACh and 1 μm MLA are shown. D, MLA inhibition concentration-response curves after a 3-min incubation of oocytes injected with a 1:1 ratio of α4β2 (■) and α7 (●) nAChR mRNA are expressed as a fraction of the current elicited by 300 and 100 μm ACh, respectively. E, MLA inhibition concentration-response curves of oocytes injected with α7(L9′T) (■) and α7(●) nAChR mRNA are expressed as a fraction of the current elicited by 1 and 100 μm ACh, respectively. Data are represented as the means ± S.E., and the curve-fitting procedure is as explained under “Experimental Procedures.”
FIGURE 2.
FIGURE 2.
A, shown are concentration-response curves to ACh of oocytes injected with α7(L9′T) nAChR mRNA in the absence of MLA (■) and in the presence of 100 pm MLA (□) after a 3 min incubation. B, concentration-response curves to ACh of oocytes injected with a 1:1 shown is a ratio of α4β2 nAChR mRNA in the absence of MLA (■) and in the presence of 10 nm (▵), 30 nm (○), 200 nm (□), and 1 μm (♢) MLA after a 3-min incubation. Data are represented as the means ± S.E., and the curve-fitting procedure is as explained under “Experimental Procedures.”
FIGURE 3.
FIGURE 3.
A, MLA inhibition concentration-response curves of oocytes injected with a 1:1 ratio of α4β2 nAChR mRNA after a 3-min incubation (■) and without incubation (□) is expressed as a fraction of the current elicited by 100 μm ACh. B, shown are concentration-response curves to ACh of oocytes injected with a 1:1 ratio of α4β2 nAChR mRNA in the absence of MLA (■), in the presence of 200 nm MLA after a 3-min incubation (□), and in the presence of 2 μm MLA without incubation (○). C, shown are concentration-response curves of ACh of oocytes injected with α4β2 mRNA in a 1:1 (■) and 1:10 (□) ratio (solid lines) and α4(D204C)β2 mRNA in a 1:1 (●) and 1:10 (○) ratio (dashed lines). Currents are normalized to the maximum current of each individual cell. D, shown are MLA inhibition concentration-response curves of oocytes injected with α4β2 mRNA in a 1:1 (■) and 1:10 (□) ratio (solid lines) and α4(D204C)β2 mRNA in a 1:1 (●) and 1:10 (○) ratio (dashed lines). Currents are normalized to the current elicited by 300 μm ACh (1:1), 1 μm (1:10), 30 μm ACh (D204C 1:1), or 1 μm (D204C 1:10). Data are represented as the means ± S.E., and the curve-fitting procedure is as explained in the data analysis under “Experimental Procedures.”
FIGURE 4.
FIGURE 4.
Current-voltage (I-V) relationship of oocytes injected with a 1:1 ratio of α4β2 nAChR mRNA in the absence of MLA or after a 3 min incubation with MLA. A, the currents normalized to the response to 100 μm ACh at −90 mV are shown for different voltages when 100 μm ACh (■), 300 nm MLA (▴), or 300 nm MLA and 100 μm ACh (▾) is applied. B, the fraction of the ACh response that is inhibited by 300 nm MLA at different holding potentials is shown. Slope = 0.0023 ± 0.001, p = 0.19 cf. 0, z-test, n = 4). Data points are given as the means ± S.E.
FIGURE 5.
FIGURE 5.
A, schematics of α4β2 nAChR expression with principal (+) and complementary (−) sides of the receptor interfaces are shown. The (α4)3(β2)2, (α4[D204C])3(β2)2 (1:1 mRNA injection ratio), and (α4[D204C])2(β2)3 (1:10 mRNA injection ratio) are represented with α subunits (black circles), with the D204C mutation (white dot) shown, and with β subunits (gray circles). The D204C mutation is located at the α4-α4 and β2-α4 interfaces of the (α4[D204C])3(β2)2 receptor and at the β2-α4 interfaces only on the (α4[D204C])2(β2)3 receptor. The reactive MLA-maleimide (white square) is covalently trapped with the D204C mutant residue only at the α4-α4 interface of the (α4[D204C])3(β2)2 receptor. B, shown is a structural model of the α4-α4 interface with the MLA-maleimide covalently trapped by cysteine (D204C).
FIGURE 6.
FIGURE 6.
MLA-maleimide inhibition of α4β2 nAChRs is identical to MLA. A, the chemical structure of MLA (i) and MLA-maleimide (ii) shows the location of the reactive maleimide group. B, shown are raw traces from a single experiment demonstrating inhibition of ACh-activation of (α4)3(β2)2 (i) and (α4)2(β2)3 (ii) receptors by 100 nm MLA or 100 nm MLA-maleimide after a 3-min incubation. C, shown is the mean ± S.E. of current responses normalized to 100 or 1 μm ACh for (α4)3(β2)2 and (α4)2(β2)3 nAChRs, respectively. Inhibition of ACh (filled bars) by 100 nm MLA or 100 nm MLA-maleimide (open bars) after 3 min of incubation was not significantly different at (α4)3(β2)2 or (α4)2(β2)3 nAChRs (p > 0.05; Student's t test; respectively, n = 4).
FIGURE 7.
FIGURE 7.
MLA-maleimide irreversibly inhibits α4(D204C)β2 nAChRs injected in a 1:1 but not 1:10 ratio. A, shown is the initial trapping experiment of MLA-maleimide to the introduced cysteine. i, 10 μm ACh was applied to α4(D204C)β2 nAChRs injected in a 1:1 ratio (open bar). 1 μm MLA-maleimide was applied for 30 s followed by a 17-min wash with buffer to remove excess MLA-maleimide. 10 μm ACh was applied again, demonstrating an irreversible reduction in the ACh-elicited response. ii, shown is an identical experiment, except 10 μm MLA were incubated for 3 min then co-applied with 1 μm MLA-maleimide followed by a 17-min wash and application of 10 μm ACh. iii, 1 μm ACh was applied to α4(D204C)β2 nAChRs injected in a 1:10 ratio (open bar). 1 μm MLA-maleimide was applied for 30 s followed by a 17-min wash with buffer to remove excess MLA-maleimide. 1 μm ACh was applied again, blocking the irreversible reduction in the ACh-elicited response. B, shown is the mean ± S.E. of ACh-elicited responses after 30 s of treatment of 1 μm MLA-maleimide and a 17-min wash, normalized to the initial ACh-elicited response. 1 μm MLA-maleimide significantly reduced the ACh-elicited response in α4(D204C)β2 nAChRs injected in a 1:1 ratio (filled bar, middle) compared with a 1:10 (open bar) ratio (p < 0.01, n = 3–4; Student's t test). Preincubation for 3 min and co-application of 10 μm MLA with 1 μm MLA-maleimide prevented the MLA-maleimide reaction (filled bars, left), significantly blocking the reduction of the ACh-elicited response at the α4(D204C)β2 nAChR injected in a 1:1 ratio (p < 0.01, n = 4–6; Student's t test). C, rate of reaction experiments with individual oocytes expressing α4(D204C)β2 nAChRs injected in a 1:1 ratio (i and ii), α4β2 nAChRs injected in a 1:1 ratio (iii), and α4(D204C)β2 nAChRs injected in a 1:10 ratio (iv). An EC50 concentration of ACh (10, 10, 100, and 1 μm for (i–iv), open bars) was applied before application of 1 μm MLA (i) or) MLA-maleimide (filled bars) (ii–iv. Each successive 30-s application of MLA or MLA-maleimide was followed by a 17-min wash with buffer to remove excess MLA and then an ACh application to measure the reduction in current resulting from trapping of the MLA-maleimide with the cysteine. D, shown is the mean ± S.E. of ACh normalized to the initial response to ACh after the cumulative time of successive 1 μm MLA or MLA-maleimide applications. Rates of reaction of MLA-maleimide to (α4[D204C])3(β2)2 (●), (α4[D204C])2(β2)3 (○), and α4β2 wild type (■) and MLA to (α4[D204C])3(β2)2 (□) are plotted with a single exponential fit to the average responses shown as described under “Experimental Procedures” (n = 3–6 for each rate of reaction). E, shown is the mean ± S.E. of the maximum reduction of ACh-elicited current as a fraction of the initial ACh-elicited current. The maximum reduction in current was determined either by fitting each individual experiment to a single exponential decay (α4(D204C)β2 1:1 and 1:10 ratio and MLA-maleimide; open bars) or the reduction in ACh-elicited response after 120 s of cumulative MLA or MLA-maleimide addition (α4β2 and MLA or MLA-maleimide and α4(D204C)β2 1:1 and MLA). The reduction in ACh-elicited response is significantly greater for α4D204Cβ2 injected in the 1:1 compared with the 1:10 ratio (p < 0.001, n = 3- 5), indicating that MLA-maleimide is being trapped at the D204C residue in the α4-α4 interface (white bars). The ACh-response recovers up to 90% of the initial response, significantly different to the application of MLA-maleimide applied to the (α4[D204C])3(β2)2 nAChR, injected in a 1:1 ratio (p < 0.01, n ≥ 3; Student's t test).

Similar articles

Cited by

References

    1. Gotti C., Clementi F. (2004) Neuronal nicotinic receptors. From structure to pathology. Prog. Neurobiol. 74, 363–396 - PubMed
    1. Karlin A. (2002) Emerging structure of the nicotinic acetylcholine receptors. Nat. Rev. Neurosci. 3, 102–114 - PubMed
    1. Borovikova L. V., Ivanova S., Zhang M., Yang H., Botchkina G. I., Watkins L. R, Wang H., Abumrad N., Eaton J. W., Tracey K. J. (2000) Vagus nerve stimulation attenuates the systemic inflammatory response to endotoxin. Nature 405, 458–462 - PubMed
    1. Jensen A. A., Frølund B., Liljefors T., Krogsgaard-Larsen P. (2005) Neuronal nicotinic acetylcholine receptors. Structural revelations, target identifications, and therapeutic inspirations. J. Med. Chem. 48, 4705–4745 - PubMed
    1. Grosman C., Zhou M., Auerbach A. (2000) Mapping the conformational wave of acetylcholine receptor channel gating. Nature 403, 773–776 - PubMed

Publication types

LinkOut - more resources