. 2014 Jan;111(1):69-83.
doi: 10.1002/bit.25008. Epub 2013 Aug 16.

Allogeneic cell therapy bioprocess economics and optimization: single-use cell expansion technologies

Affiliations
Free PMC article

Allogeneic cell therapy bioprocess economics and optimization: single-use cell expansion technologies

Ana S Simaria et al. Biotechnol Bioeng. 2014 Jan.
Free PMC article

Abstract

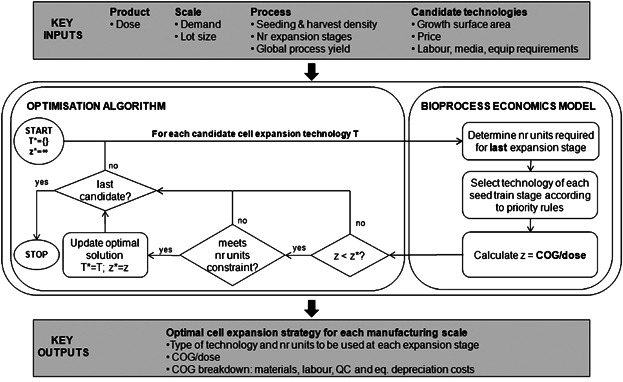
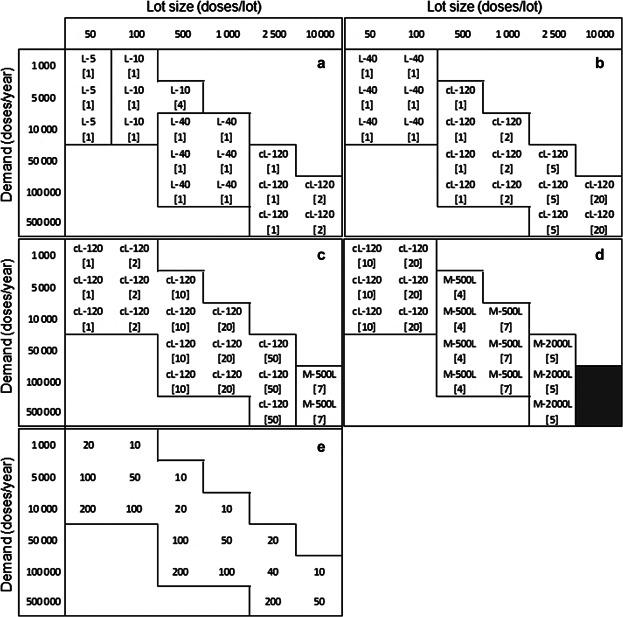
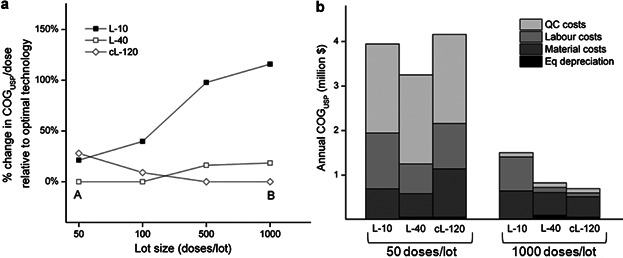
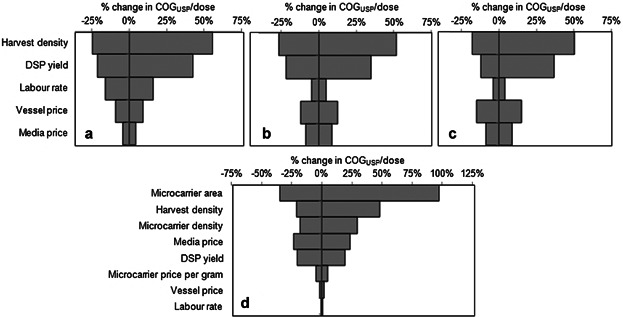
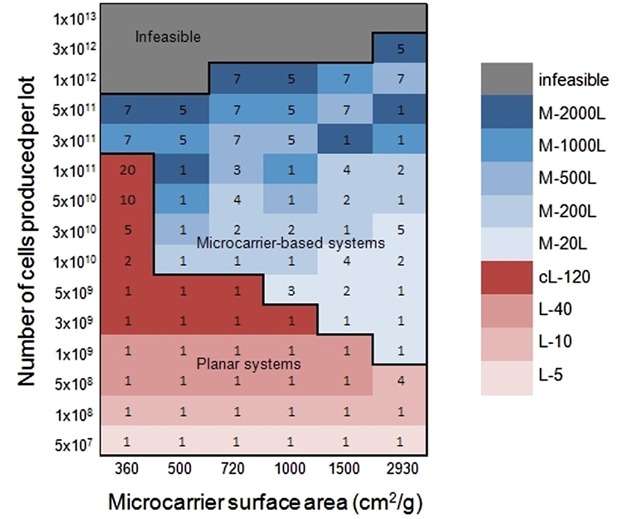
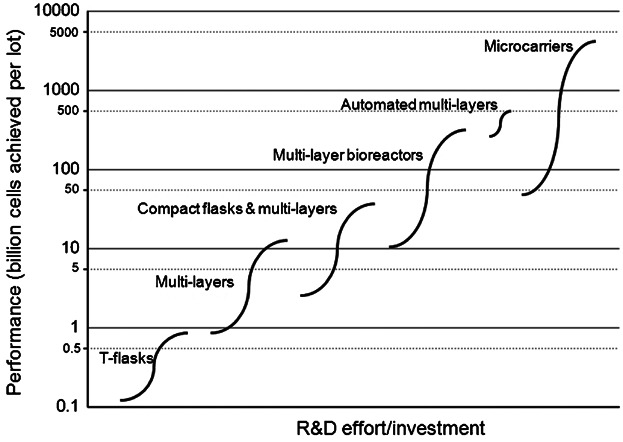
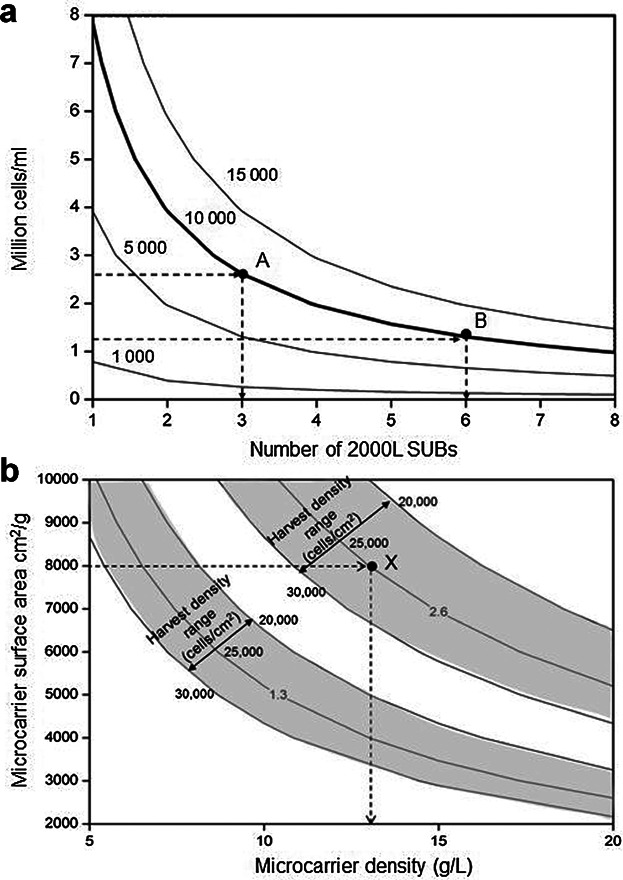
For allogeneic cell therapies to reach their therapeutic potential, challenges related to achieving scalable and robust manufacturing processes will need to be addressed. A particular challenge is producing lot-sizes capable of meeting commercial demands of up to 10(9) cells/dose for large patient numbers due to the current limitations of expansion technologies. This article describes the application of a decisional tool to identify the most cost-effective expansion technologies for different scales of production as well as current gaps in the technology capabilities for allogeneic cell therapy manufacture. The tool integrates bioprocess economics with optimization to assess the economic competitiveness of planar and microcarrier-based cell expansion technologies. Visualization methods were used to identify the production scales where planar technologies will cease to be cost-effective and where microcarrier-based bioreactors become the only option. The tool outputs also predict that for the industry to be sustainable for high demand scenarios, significant increases will likely be needed in the performance capabilities of microcarrier-based systems. These data are presented using a technology S-curve as well as windows of operation to identify the combination of cell productivities and scale of single-use bioreactors required to meet future lot sizes. The modeling insights can be used to identify where future R&D investment should be focused to improve the performance of the most promising technologies so that they become a robust and scalable option that enables the cell therapy industry reach commercially relevant lot sizes. The tool outputs can facilitate decision-making very early on in development and be used to predict, and better manage, the risk of process changes needed as products proceed through the development pathway.

Keywords: allogeneic cell therapy manufacture; bioprocess economics; cell factories; microcarriers; single-use cell expansion; stem cells.


Figures

Figure 1
Figure 1
Cell expansion optimization framework.
Figure 2
Figure 2
Optimal cell expansion technologies across a matrix of demands and lot sizes for a dose of (a) 106 cells, (b) 107 cells, (c) 108 cells, and (d) 109 cells. Each matrix cell shows the name of the optimal technology for a particular combination of demand and lot size and the number of units required per lot (inside brackets). For L-40 and cL-120 the value inside brackets represents the number of automated units required (i.e., number of sets of 4 units). The use of microcarriers was allowed only when the maximum number of units was exceeded for all planar technologies. The gray areas represent production scenarios that cannot be met by any candidate technology. Matrix (e) shows the number of lots run per year for each combination of demand and lot size.
Figure 3
Figure 3
Comparison between L-10, L-40, and cL-120 for a fixed demand of 10,000 doses/year and across different lot sizes for a dose of 107 cells in terms of (a) % change in COGUSP/dose relative to optimal technology and (b) COGUSP structure. (a) and (b) are the optimal solutions for lot sizes of 50 and 1,000 doses.
Figure 4
Figure 4
Tornado diagrams showing the sensitivity of COGUSP/dose to the key bioprocess economics model parameters. Results are shown for manufacturing scenarios where the following cell expansion technologies are used per lot in the base case scenario: (a) 74 × L-10 vessels, (b) 19 × L-40 handled by five ACFMs, (c) 8 × cL-120 handled by two ACFMs, (d) 5 × M-2000L bioreactors with microcarriers. The corresponding values of dose, demand, and lot size are: (a), (b), (c) dose = 107 cells, demand = 10,000 doses/year, lot size = 1,000 doses/lot, (d) dose = 109 cells, demand = 50,000 doses/year, lot size = 2,500 doses/lot. The base case values of each parameter are shown in Table III. For each parameter the base case values were changed by ±30% to generate the plots. The vertical axis intersects the horizontal axis at the base case value in each diagram.
Figure 5
Figure 5
Impact of microcarrier surface area on the optimal cell expansion strategy across different lot sizes (number of cells produced per lot). The numbers inside the plot represent the number of units of the optimal technology required for the last expansion stage, for each combination of microcarrier surface area and number of cells produced per lot. For L-40 and cL-120, the value represents the number of automated units required (i.e., number of sets of 4 units). The gray areas represent production scenarios that cannot be met by any candidate technology.
Figure 6
Figure 6
Conceptual illustration of a technology S-curve showing the evolution of expansion technologies used in cell therapy manufacture. The limits of each S-curve correspond to the amount of cells achieved by the smallest and largest size of each technology type when using the maximum number of units (80 for planar and 8 for microcarriers). Automated multi-layers refer to L-40 and cL-120. The x-axis represents qualitatively the R&D effort required for a company currently using T-flasks to change to other cell expansion technologies.
Figure 7
Figure 7
Contour plots showing characteristics of required future microcarrier performance. (a) Billion cells per lot achieved as a function of the number of 2000L SUBs used and the million cells/mL present in the microcarrier culture. The bold line represents the target of 10,000 billion cells/lot that can be achieved using different configurations including points A and B. (b) Million cells/mL achieved in a microcarrier culture as a function of the microcarrier density and surface area. The shaded areas highlight zones with the same value of million cells/mL (1.3 or 2.6) that can be achieved with harvest densities ranging from 20,000 cells/cm2 (upper limit of shaded area) to 30,000 cells/cm2 (lower limit of shaded area). X represents a possible setup to achieve 2.6 × 10⁶ cells/mL.

Similar articles

Cited by

References

    1. Birch JR, Racher AJ. Antibody production. Adv Drug Deliver Rev. 2006;58:671–685. - PubMed
    1. Bowden MJ. Moore's Law and the technology S-curve. Curr Issues Technol Manage. 2004;8(1):1–4.
    1. Brandenberger R, Burger S, Campbell A, Fong T, Lapinskas E, Rowley JA. Cell therapy bioprocessing. BioProcess Int. 2011;9(Suppl. 1):30–37.
    1. Christ B, Stock P. Mesenchymal stem cell derived hepatocytes for functional liver replacement. Front Immunol. 2012;3(168):1–10. - PMC - PubMed
    1. DelaRosa O, Dalemans W, Lombardo E. Toll-like receptors as modulators of mesenchymal stem cells. Front Immunol. 2012;3(182):1–8. - PMC - PubMed

Publication types

MeSH terms