. 2013 Oct;54(10):2665-77.
doi: 10.1194/jlr.M037044. Epub 2013 Jul 26.

Fatty acid remodeling in cellular glycerophospholipids following the activation of human T cells

Affiliations

Fatty acid remodeling in cellular glycerophospholipids following the activation of human T cells

Philippe Pierre Robichaud et al. J Lipid Res. 2013 Oct.

Abstract

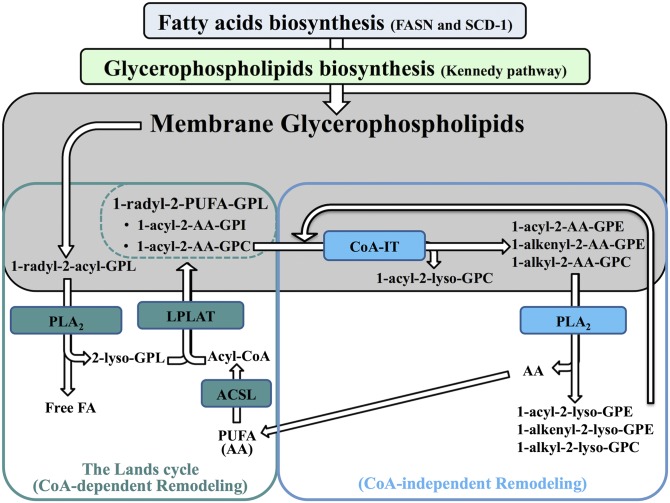
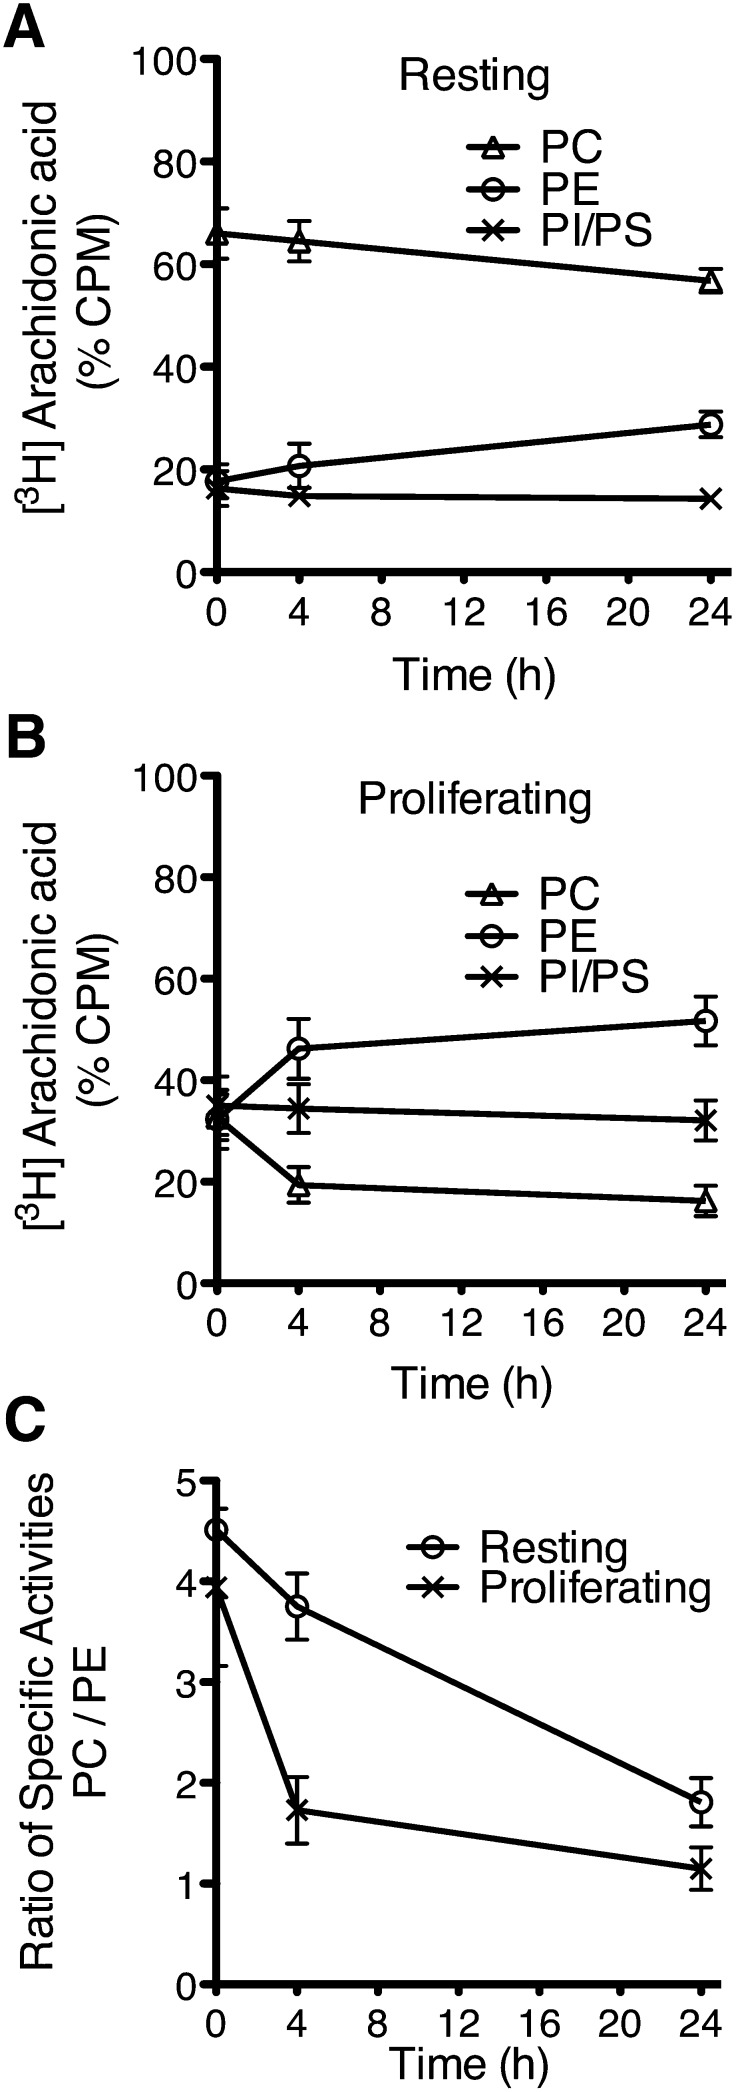
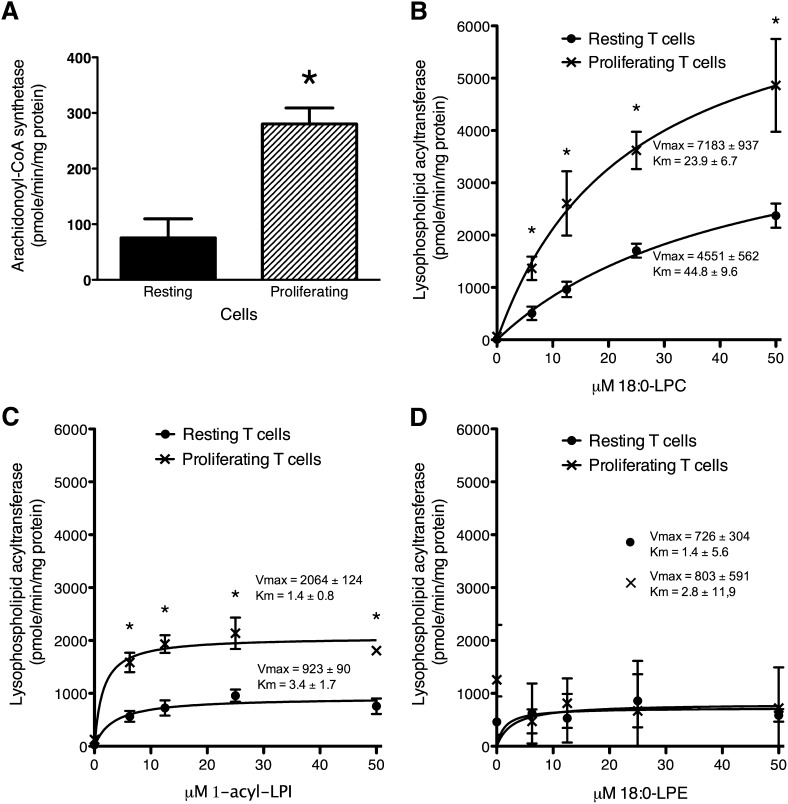
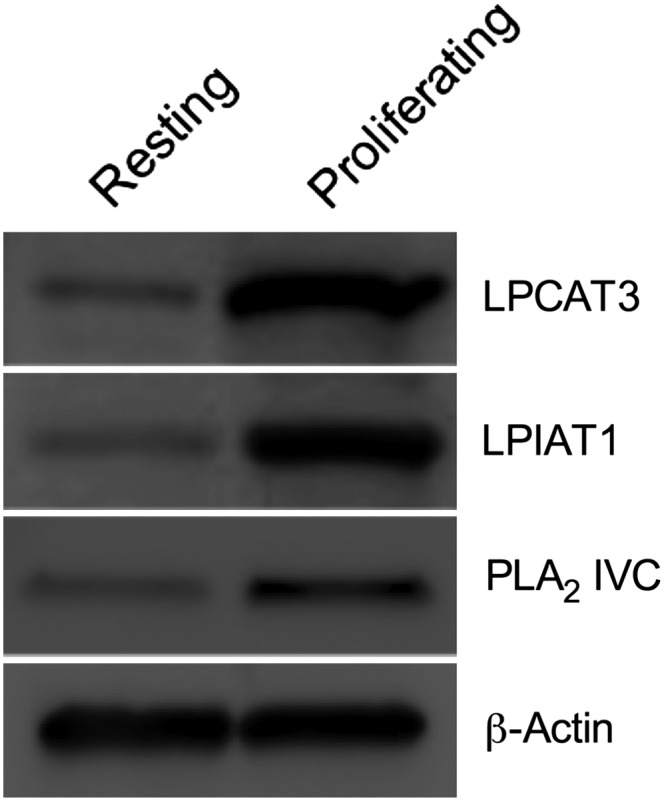
Changes in fatty acid (FA) and glycerophospholipid (GPL) metabolism associated with cell cycle entry are not fully understood. In this study FA-GPL remodeling was investigated in resting and proliferating primary human T cells. Significant changes were measured in the composition and distribution of FAs in GPLs following receptor activation of human T cells. The FA distribution of proliferating T cells was very similar to that of the human Jurkat T cell line and when the stimulus was removed from proliferating T cells, they stopped proliferating and the FA distribution largely reverted back to that of resting T cells. The cellular content of saturated and monounsaturated FAs was significantly increased in proliferating cells, which was associated with an induction of FA synthase and stearoyl-CoA desaturase-1 gene expression. Additionally, cellular arachidonate was redistributed in GPLs in a distinct pattern that was unlike any other FAs. This redistribution was associated with an induction of CoA-dependent and CoA-independent remodeling. Accordingly, significant changes in the expression of several acyl-CoA synthetases, lysophospholipid acyltransferases, and phospholipase A2 were measured. Overall, these results suggest that metabolic pathways are activated in proliferating T cells that may represent fundamental changes associated with human cell proliferation.

Keywords: acyl-CoA synthetase; arachidonic acid; fatty acid synthase; lysophospholipid acyltransferase; phospholipase A2; stearoyl-CoA desaturase 1.


Figures

Fig. 1.
Fig. 1.
Schematic representation of FA and GPL biosynthesis and remodeling. During de novo biosynthesis of GPLs by the Kennedy pathway, SFAs and MUFAs are mainly incorporated in position sn-1 and sn-2 of the newly synthesized GPLs. These FAs are biosynthesized by FASN and SCD-1. PUFAs are incorporated into GPLs by Lands cycle remodeling, which is characterized by the hydrolysis of SFAs or MUFAs from the sn-2 position of GPLs by a PLA2 followed by a reacylation with PUFAs by a LPLAT. Free FA must be activated by an ACSL to produce the acyl-CoA required for its incorporation in the 2-lyso-GPL previously produced by the PLA2. Highly unsaturated long chain PUFAs, like AA (20:4n-6), which are mainly incorporated into 1-acyl-glycerophosphatidylcholine (GPC) in the Lands cycle, are directly transferred to other specific GPL species [1-acyl-glycerophosphatidylethanolamine (GPE), 1-alk-enyl-GPE, and 1-alkyl-GPC] by the CoA-IT. This CoA-independent remodeling is involved in the maturation of GPLs and the distribution of the AA in GPLs.
Fig. 2.
Fig. 2.
The mass content of FAs (A) and the FA distribution (B) in total GPLs from resting and proliferating T cells. Lipids were extracted from resting T cells incubated without stimulation for 3 days and proliferating T cells that were incubated with 1 μg/ml anti-CD3 and 20 U/ml IL-2 for 3 days. The FAs were hydrolyzed and transmethylated, and individual FAs were measured by GC-FID. The results are the mean ± SEM of 9–10 independent experiments. *Different from resting cells (P < 0.05) as determined by Student's t-test.
Fig. 3.
Fig. 3.
FASN and SCD1 expression in resting and proliferating T cells. Proteins (20 μg) from resting T cells and proliferating T cells were separated by SDS-PAGE and transferred on PVDF membrane as described in the Experimental Procedures section. Western blotting was performed using anti-FASN (1:1,000) and anti-SCD1 (1:1,000) antibodies, and anti-β-actin (1:10,000) as loading control. These images are representative of three independent experiments using different donors.
Fig. 4.
Fig. 4.
Total FA content (A) and the FA distribution (B) of GPL classes from different cell populations. Lipids were extracted from resting T cells incubated without stimulation for 3 days, proliferating T cells incubated with 1 μg/ml anti-CD3 and 20 U/ml IL-2 for 3 days, proliferating T cells incubated for an additional 4 days without stimulation (S-NS), and Jurkat cells. GPL classes were separated by HPLC and PC, PE, and PI/PS were collected separately. The FAs from each fraction were hydrolyzed and transmethylated, and total FAs associated with each class were measured by GC-FID. These results are the mean ± SEM of 9–10 independent experiments for resting and proliferating T cells and 3 independent experiments for the Jurkat and S-NS cells. Values within each GPL class that do not have a common superscript are significantly different (P < 0.05) as determined by one-way ANOVA.
Fig. 5.
Fig. 5.
The distribution of FAs within GPL classes from different cell populations. Lipids were extracted from resting T cells incubated without stimulation for 3 days, proliferating T cells incubated with 1 μg/ml anti-CD3 and 20 U/ml IL-2 for 3 days, proliferating T cells incubated for an additional 4 days without stimulation (S-NS), and Jurkat cells. GPL classes were separated by HPLC and PC, PE, and PI/PS were collected separately. The FAs from each fraction were hydrolyzed and transmethylated, and individual FAs were measured by GC-FID. The results are the mean ± SEM of 9–10 independent experiments for resting and proliferating T cells and 3 independent experiments for the Jurkat and S-NS cells. Values within each FA that do not have a common superscript are significantly different (P < 0.05) as determined by one-way ANOVA.
Fig. 6.
Fig. 6.
The mass content of FAs within GPL classes of resting and proliferating T cells. Lipids were extracted from resting T cells incubated without stimulation for 3 days or proliferating T cells incubated with 1 μg/ml anti-CD3 and 20 U/ml IL-2 for 3 days. GPL classes were separated by HPLC and PC, PE, and PI/PS were collected separately. The FAs from each fraction were hydrolyzed and transmethylated, and individual FAs were measured by GC-FID. The results are the mean ± SEM of 9–10 independent experiments. *Different from resting cells (P < 0.05) as determined by Student's t-test.
Fig. 7.
Fig. 7.
The distribution of FAs between GPL classes of resting and proliferating T cells. Lipids were extracted from resting T cells incubated without stimulation for 3 days or proliferating T cells incubated with 1 μg/ml anti-CD3 and 20 U/ml IL-2 for 3 days. GPL classes were separated by HPLC and PC, PE, and PI/PS were collected separately. The FAs from each fraction were hydrolyzed and transmethylated, and individual FAs were measured by GC-FID. Values represent the mean ± SEM of 9–10 independent experiments. *Different from resting cells (P < 0.05) as determined by Student's t-test.
Fig. 8.
Fig. 8.
AA mass content in GPL classes from different cell populations. Lipids were extracted from resting T cells incubated without stimulation for 3 days, proliferating T cells incubated with 1 μg/ml anti-CD3 and 20 units/ml IL-2 for 3 days, proliferating T cells incubated for an additional 4 days without stimulation (S-NS), and Jurkat cells. GPL classes were separated by HPLC and PC, PE, and PI/PS were collected separately. The FAs from each fraction were hydrolyzed and transmethylated, and FAs were measured by GC-FID. Values represent the mean ± SEM of 9–10 independent experiments for resting and proliferating T cells and 3 independent experiments for the Jurkat and S-NS T cells. Values within each GPL class that do not have a common superscript are significantly different (P < 0.05) as determined by one-way ANOVA.
Fig. 9.
Fig. 9.
AA composition of GPL subclasses from resting and proliferating T cells. Lipids were extracted from resting T cells incubated without stimulation for 3 days and proliferating T cells incubated with 1 μg/ml anti-CD3 and 20 units/ml IL-2 for 3 days. PE and PC were separated by HPLC, and 1-acyl-, 1-alkyl-, and 1-alk-1-enyl-linked subclasses were separated and associated FAs were measured by GC-MS using 2H8-AA as internal standard. Values represent the mean ± SEM of three independent experiments. *Different from resting cells (P < 0.05) as determined by Student's t-test.
Fig. 10.
Fig. 10.
Arachidonate-phospholipid remodeling in resting and proliferating T cells. Resting T cells incubated for 3 days without stimulation (A) and proliferating T cells incubated with 1 μg/ml anti-CD3 and 20 units/ml IL-2 for 3 days (B) were pulse labeled with [3H]AA, washed, and incubated for the indicated times prior to lipid extraction. GPL classes were separated by HPLC and PC, PE, and PI/PS were collected separately. The FAs from each fraction were hydrolyzed and transmethylated, and fatty acids were measured by GC-FID and the radioactivity associated with each fraction was measured by liquid scintillation counting. To calculate the specific activity in (C), the counts per minute were divided by the mass of AA in each fraction. Values represent the mean ± SD of six to seven independent experiments.
Fig. 11.
Fig. 11.
Arachidonoyl-CoA synthetase (A), LPCAT (B), LPIAT (C), and lysophosphatidylethanolamine (D) activities in resting and proliferating human T cells. Resting T cells incubated for 3 days without stimulation and proliferating T cells incubated with 1 μg/ml anti-CD3 and 20 units/ml IL-2 for 3 days were sonicated and activities were measured in homogenates as described in the Experimental Procedures section. Values represent the mean ± SEM (A) and mean ± SD (B–D) of three independent experiments. *Different from resting cells (P < 0.05) as determined by Student's t-test.
Fig. 12.
Fig. 12.
LPCAT3, LPIAT1, and PLA2 IVC expression in resting and proliferating T cells. Proteins (20 μg) from resting T cells and proliferating T cells were separated by SDS-PAGE and transferred on PVDF membrane as described in the Experimental Procedures section. Western blotting was performed using anti-LPCAT3 (1:1,000), anti-LPIAT1 (1:1,000), and anti-PLA2 IVC (1:1,000) antibodies and anti-β-actin (1:10000) as loading control. These images are representative of three independent experiments using different donors.

References

    1. Spector A. A., Yorek M. A. 1985. Membrane lipid composition and cellular function. J. Lipid Res. 26: 1015–1035 - PubMed
    1. Yamashita A., Sugiura T., Waku K. 1997. Acyltransferases and transacylases involved in fatty acid remodeling of phospholipids and metabolism of bioactive lipids in mammalian cells. J. Biochem. 122: 1–16 - PubMed
    1. Fahy E., Subramaniam S., Brown H. A., Glass C. K., Merrill A. H., Jr, Murphy R. C., Raetz C. R., Russell D. W., Seyama Y., Shaw W., et al. 2005. A comprehensive classification system for lipids. J. Lipid Res. 46: 839–861 - PubMed
    1. Lands W. E., Inoue M., Sugiura Y., Okuyama H. 1982. Selective incorporation of polyunsaturated fatty acids into phosphatidylcholine by rat liver microsomes. J. Biol. Chem. 257: 14968–14972 - PubMed
    1. Diaz B. L., Arm J. P. 2003. Phospholipase A(2). Prostaglandins Leukot. Essent. Fatty Acids. 69: 87–97 - PubMed

Publication types

MeSH terms