. 2013 Jul 24;8(7):e68963.
doi: 10.1371/journal.pone.0068963. Print 2013.

Oxidative burst of circulating neutrophils following traumatic brain injury in human

Affiliations

Oxidative burst of circulating neutrophils following traumatic brain injury in human

Yiliu Liao et al. PLoS One. .

Erratum in

  • PLoS One. 2013;8(9). doi:10.1371/annotation/73ce45d3-4478-4c06-a4d2-3274b6222bae

Abstract

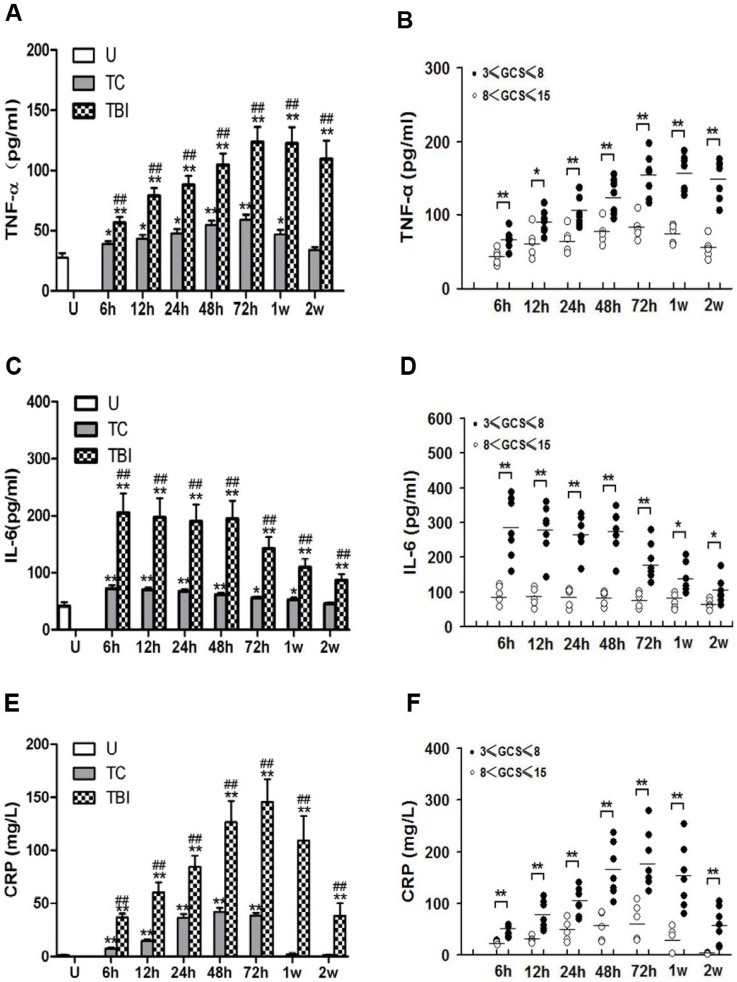
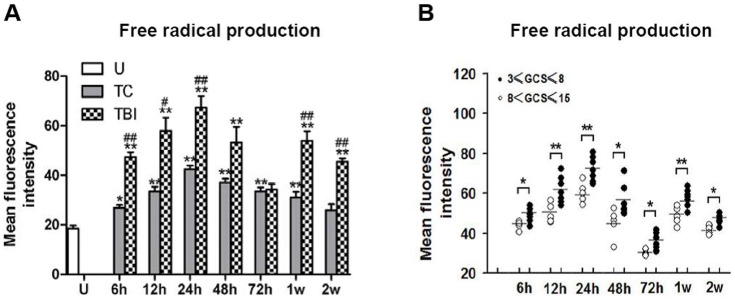
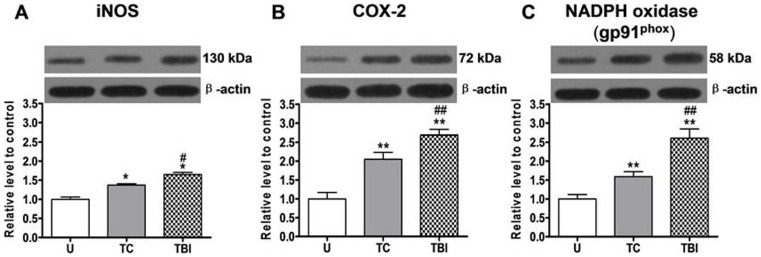
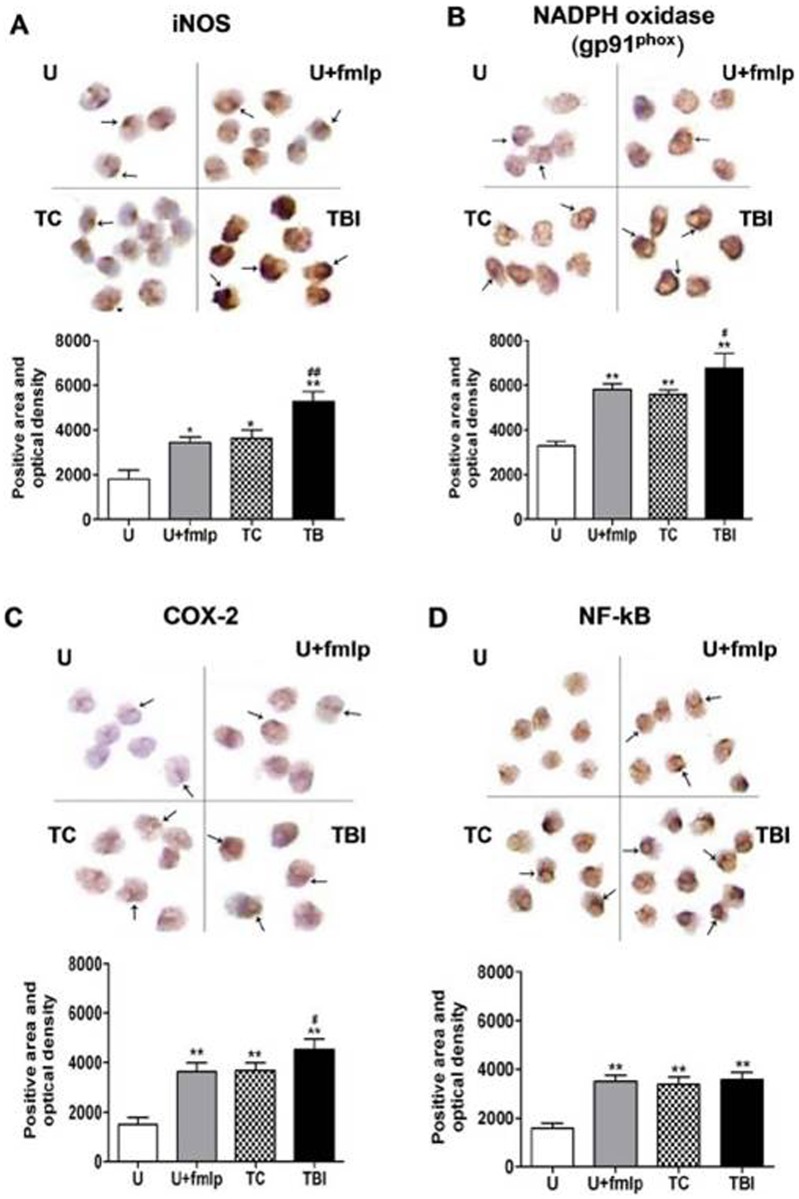
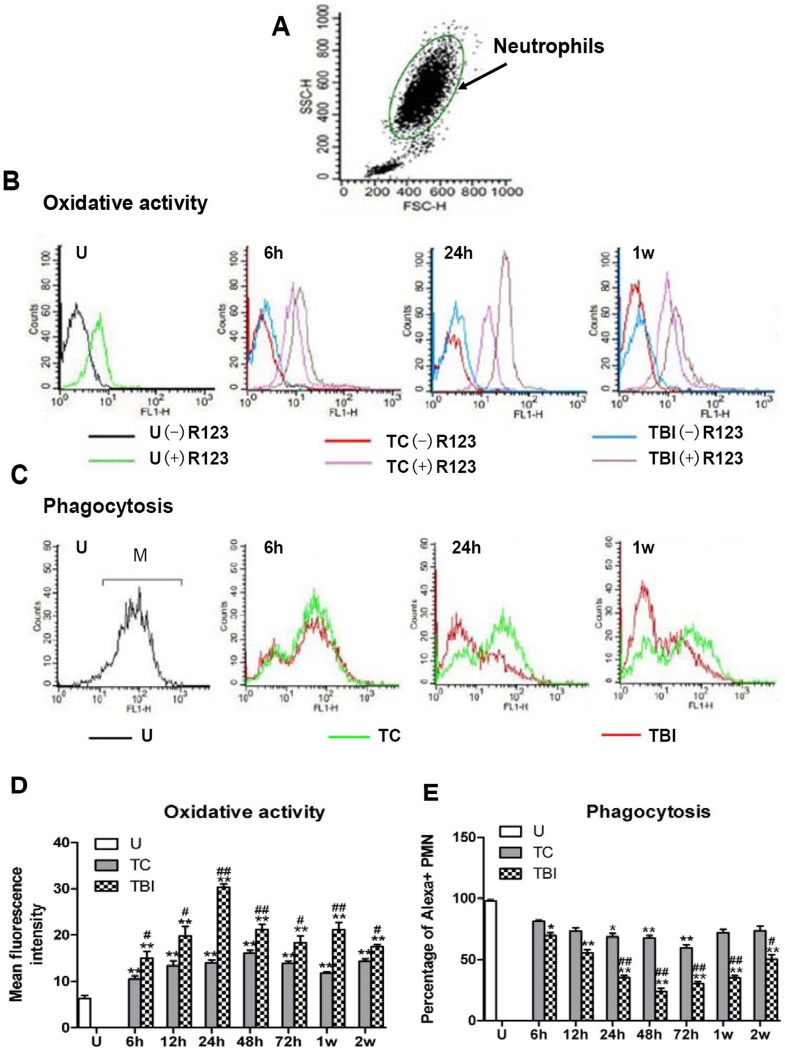
Besides secondary injury at the lesional site, Traumatic brain injury (TBI) can cause a systemic inflammatory response, which may cause damage to initially unaffected organs and potentially further exacerbate the original injury. Here we investigated plasma levels of important inflammatory mediators, oxidative activity of circulating leukocytes, particularly focusing on neutrophils, from TBI subjects and control subjects with general trauma from 6 hours to 2 weeks following injury, comparing with values from uninjured subjects. We observed increased plasma level of inflammatory cytokines/molecules TNF-α, IL-6 and CRP, dramatically increased circulating leukocyte counts and elevated expression of TNF-α and iNOS in circulating leukocytes from TBI patients, which suggests a systemic inflammatory response following TBI. Our data further showed increased free radical production in leukocyte homogenates and elevated expression of key oxidative enzymes iNOS, COX-2 and NADPH oxidase (gp91(phox)) in circulating leukocytes, indicating an intense induction of oxidative burst following TBI, which is significantly greater than that in control subjects with general trauma. Furthermore, flow cytometry assay proved neutrophils as the largest population in circulation after TBI and showed significantly up-regulated oxidative activity and suppressed phagocytosis rate for circulating neutrophils following brain trauma. It suggests that the highly activated neutrophils might play an important role in the secondary damage, even outside the injured brain. Taken together, the potent systemic inflammatory response induced by TBI, especially the intensively increase oxidative activity of circulating leukocytes, mainly neutrophils, may lead to a systemic damage, dysfunction/damage of bystander tissues/organs and even further exacerbate secondary local damage. Controlling these pathophysiological processes may be a promising therapeutic strategy and will protect unaffected organs and the injured brain from the secondary damage.


Conflict of interest statement

Competing Interests: The authors have declared that no competing interests exist.

Figures

Figure 1
Figure 1. Inflammatory marker concentrations in plasma.
Mean changes in TNF-α (A, B), IL-6 (C, D) and CRP (E, F) in plasma after injury in trauma controls and traumatic brain injury subjects are presented. Concentration is expressed as mean ± SE values and samples are plotted as histograms at times encompassing 6 h-2 weeks after injury. Uninjured subjects (n = 6) (U, open bars) had low concentration of TNF-α, IL-6 and CRP. The concentration of TNF-α, IL-6 and CRP in trauma control (n = 10) (TC, grey bars) subject was significantly increased at 6 h-1 week (for CRP only to 72 hours) and in traumatic brain injury (n = 12) (TBI, black bars) subject was significantly increased at 6 h-2 weeks after injury. In contrast, increases of TNF-α, IL-6 and CRP after TBI were greater than those of TC subjects at throughout the entire observation period. (B, D, F) The patients with traumatic brain injury were divided into severe (STBI, black spots) (n = 5) and moderate (MTBI, white spots) (n = 7) brain injury. The concentration of TNF-α, IL-6 and CRP in TBI subject with STBI and MTBI were plotted as graphs at times encompassing 6 h-2 weeks after injury. Increases of the concentration of TNF-α, IL-6 and CRP from STBI subjects were greater than those from MTBI subjects throughout the entire observation period (from 6 h to 2 weeks after injury). **P<0.01; *P<0.05, significantly different from uninjured by Fisher’s protected t tests. ##P<0.01; #P<0.05, significantly different from trauma controls by Fisher’s protected t tests. **P<0.01; *P<0.05, significantly different from MTBI by Fisher’s protected t tests.
Figure 2
Figure 2. Free radical production in leukocyte homogenates.
The presence of free radicals in the leukocytes was estimated by the conversion of DCFH to DCF in homogenates from uninjured (U) subjects and from trauma controls (TC) and traumatic brain injury (TBI) subjects at times ranging from 6 h to 2 weeks after injury. (A) Uninjured subjects (U, open bars) had a few DCF. DCF concentrations increased significantly in TC (grey bars) and TBI (TBI, black bars) subjects at most times assessed. Changes in leukocytes from TBI subjects were greater than those from TC subjects at 6 h, 12 h, 24 h, 1 week and 2 weeks after injury. (B) Futher, mean fluorescence intensity in leukocyte homogenates of six uninjured subjects, twelve TBI subjects with five MTBI (white circles) and seven STBI (black circles) were plotted as a scatter gram. Increases of free radical in leukocytes from STBI subjects were greater than those from MTBI subjects throughout the entire observation period (from 6 h to 2 weeks after injury). **P<0.01; *P<0.05, significantly different from uninjured by Fisher’s protected t tests. ##P<0.01; #P<0.05, significantly different from trauma controls by Fisher’s protected t tests. **P<0.01; *P<0.05, significantly different from MTBI by Fisher’s protected t tests.
Figure 3
Figure 3. Expression of iNOS, COX-2 and NADPH oxidase (gp91phox) in leukocyte homogenates.
From uninjured (U), trauma controls (TC) and traumatic brain injury (TBI) subjects, expression of iNOS, COX-2 and NADPH oxidase (gp91phox) in leukocyte homogenates at 24 h after injury are determined by western blot assay. Upper blots are typical western blots of enzyme expression in each group. Lower blots are β-actin expression demonstrating equal protein loading of gels for each enzyme. Bottom bar graphs show quantification of expression by densitometry, with enzyme expression expressed as a percent of β-actin density ± SE (n = 5 all groups). iNOS, COX-2 and NADPH oxidase (gp91phox) expression in both TC and TBI subject was significantly increased, while the expression was greater after TBI than in trauma control subjects. **P<0.01; *P<0.05, significantly different from uninjured by Fisher’s protected t tests. ##P<0.01; #P<0.05, significantly different from trauma controls by Fisher’s protected t tests.
Figure 4
Figure 4. Expression of iNOS, NF-kB, COX-2 and NADPH oxidase (gp91phox) in leukocytes on blood smears.
From uninjured (U), uninjured with fMLP activation (U+fMLP) and trauma controls (TC) and traumatic brain injury (TBI) subjects, expression of iNOS, NF-κB, COX-2 and NADPH oxidase (gp91phox) in leukocytes subjects at 24 h after injury are determined with immunostaining on blood smears. Blood smears were immunostained for the NF-κB (nucleus) and the oxidative enzymes (cytoplasm). Photomicrographs at the top of A-D are typical examples of immunostained cells amplified 400 times and the arrows indicate the positive expression. Blood smears were analyzed by Image-Pro plus 6.0 software to obtain a measure of positive area and optical density. Bar graphs in lower panels of A–D depict mean positive area and optical density ± SE for each group (n = 5 subjects/group). After treatment of blood samples with fMLP and in TC and TBI subjects, expression of iNOS, NF-kB, COX-2 and NADPH oxidase (gp91phox) all increased significantly when compared to values from uninjured subjects. iNOS, COX-2 and NADPH oxidase (gp91phox) expression was greater after TBI than in trauma control subjects. **P<0.01; *P<0.05, significantly different from uninjured by Fisher’s protected t tests. ##P<0.01; #P<0.05, significantly different from trauma controls by Fisher’s protected t tests.
Figure 5
Figure 5. Oxidative activity and phagocytosis rate of neutrophils after injury in trauma controls and TBI subjects.
(A) Example of gating of a blood sample for flow cytometry using physical characteristics of granularity (side scatter) and size (forward scatter). Neutrophils constituted the largest population. (B) Histograms plotting the number of cells vs. intensity of R123 fluorescence (log scale) produced by incubation of blood samples with DHR123 from uninjured subjects (U, green lines) and from trauma controls (TC, purple lines) and TBI (grey lines) subjects at 6 h, 12 h, 24 h, 48 h, 72 h, 1 week and 2 weeks after injury (only representative images from u, 6 h, 24 h and 1 w are shown in the figure). Samples incubated without DHR123 revealed background fluorescence for uninjured (black line), TC (red lines) and TBI (blue lines) subjects. Both TC and TBI subjects had increases in fluorescence due to oxidative burst in neutrophils, while the TBI subjects increased more than trauma control subjects. (C) Neutrophils of uninjured subjects engulfed Alexa-labeled E. coli, the proportion of neutrophils with the labeled fluorescent analyzed by flow cytometry was phagocytosis rate M. Graphs plotting the number of cells vs. intensity of Alexa fluorescence (log scale) from uninjured subjects (U, black line) and from TC (green lines) and TBI (red lines) subjects at 6 h, 12 h, 24 h, 48 h, 72 h, 1 week and 2 weeks after injury. Both TC and TBI subjects had decreases in phagocytosis rate of neutrophils, while the TBI subjects decreased more than trauma control subjects. (D and E) Oxidative activity is expressed as mean ± SE values of R123 fluorescence (after subtraction of background fluorescence) and phagocytosis rate is expressed as mean ± SE values of the proportion of neutrophils with the labeled fluorescent. All samples are plotted as histograms at times encompassing 6 hours – 2weeks after injury. Uninjured subjects (U, open bars) had low oxidative activity. Oxidative burst in TC (grey bars) subject was significantly increased and the increase is even greater in neutrophils from TBI subjects (black bars) throughout the entire observation period (from 6 h to 2 weeks after injury). Neutrophils had substantial oxidative activity at 24 h, 48 h and 1 week after TBI. Uninjured subjects (U, open bars) had high phagocytosis rate. Phagocytosis in TC (grey bars) subject was significantly decreased in circulating neutrophils at 24 h, 48 h and 72 h. In contrast, phagocytosis rate decreased significantly at 6 h–2 weeks after TBI (black bars) in neutrophils from 6 h to 2 week in monocytes. Decreases after TBI are greater than those of trauma control subjects in neutrophils from 12 h to 2 weeks. **P<0.01; *P<0.05, significantly different from uninjured by Fisher’s protected t tests. ##P<0.01; #P<0.05, significantly different from trauma controls by Fisher’s protected t tests.

Similar articles

Cited by

References

    1. Khan F, Baguley IJ, Cameron ID (2003) 4: Rehabilitation after traumatic brain injury. Med J Aust 178: 290–295. - PubMed
    1. Siesjo BK, Siesjo P (1996) Mechanisms of secondary brain injury. Eur J Anaesthesiol 13: 247–268. - PubMed
    1. Clark RS, Schiding JK, Kaczorowski SL, Marion DW, Kochanek PM (1994) Neutrophil accumulation after traumatic brain injury in rats: comparison of weight drop and controlled cortical impact models. J Neurotrauma 11: 499–506. - PubMed
    1. Baskaran H, Yarmush ML, Berthiaume F (2000) Dynamics of tissue neutrophil sequestration after cutaneous burns in rats. J Surg Res 93: 88–96. - PubMed
    1. Bhatia RK, Pallister I, Dent C, Jones SA, Topley N (2005) Enhanced neutrophil migratory activity following major blunt trauma. Injury 36: 956–962. - PubMed

Publication types

MeSH terms