. 2013 Jul 22;8(7):e69171.
doi: 10.1371/journal.pone.0069171. Print 2013.

Foliar symptoms triggered by ozone stress in irrigated holm oaks from the city of Madrid, Spain

Affiliations

Foliar symptoms triggered by ozone stress in irrigated holm oaks from the city of Madrid, Spain

Carlos Calderón Guerrero et al. PLoS One. .

Abstract

Background: Despite abatement programs of precursors implemented in many industrialized countries, ozone remains the principal air pollutant throughout the northern hemisphere with background concentrations increasing as a consequence of economic development in former or still emerging countries and present climate change. Some of the highest ozone concentrations are measured in regions with a Mediterranean climate but the effect on the natural vegetation is alleviated by low stomatal uptake and frequent leaf xeromorphy in response to summer drought episodes characteristic of this climate. However, there is a lack of understanding of the respective role of the foliage physiology and leaf xeromorphy on the mechanistic effects of ozone in Mediterranean species. Particularly, evidence about morphological and structural changes in evergreens in response to ozone stress is missing.

Results: Our study was started after observing ozone -like injury in foliage of holm oak during the assessment of air pollution mitigation by urban trees throughout the Madrid conurbation. Our objectives were to confirm the diagnosis, investigate the extent of symptoms and analyze the ecological factors contributing to ozone injury, particularly, the site water supply. Symptoms consisted of adaxial and intercostal stippling increasing with leaf age. Underlying stippling, cells in the upper mesophyll showed HR-like reactions typical of ozone stress. The surrounding cells showed further oxidative stress markers. These morphological and micromorphological markers of ozone stress were similar to those recorded in deciduous broadleaved species. However, stippling became obvious already at an AOT40 of 21 ppm•h and was primarily found at irrigated sites. Subsequent analyses showed that irrigated trees had their stomatal conductance increased and leaf life -span reduced whereas the leaf xeromorphy remained unchanged. These findings suggest a central role of water availability versus leaf xeromorphy for ozone symptom expression by cell injury in holm oak.


Conflict of interest statement

Competing Interests: The authors have declared that no competing interests exist.

Figures

Figure 1
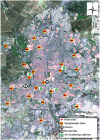
Figure 1. Localization of holm oak sites and air monitoring stations in Madrid.
The Atocha (A) and Escalonilla (E) intensive study sites were located in the city centre. Sites with at least one symptomatic tree are indicated by red arrows.
Figure 2
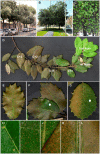
Figure 2. Visible injury caused by ozone stress in urban holm oaks from Madrid.
A the non-irrigated intensive study site at Escalonilla. Trees were asymptomatic. B, C the irrigated intensive study site at Atocha. At tree level, the older and symptomatic foliage showed dark brownish tones whilst the newly flushed leaves were green (C). DL visible injury in holm oak at Atocha in 2007. D at branch level, the symptomatic foliage showed a bronze discoloration that increased with leaf age. EL at leaf level, symptoms were characterized by, tiny, slightly depressed, intercostal and necrotic adaxial stippling surrounded by still green leaf parts. The high stippling frequency gave an overall bronze appearance to the injured leaf (E, L). Shaded leaf parts (*) showed less injury (FG). The stippling frequency increased with leaf age (asymptomatic: H: C+0; symptomatic: I: C+0, J: C+1, K: C+2, L: C+3; leaf formation: C+0∶2007, C+1∶2006, C+2∶2005, C+3∶2004).
Figure 3
Figure 3. Climate diagram.
Climatic conditions in Madrid and monthly irrigation totals at the Atocha intensive study site. Reference period for the climatic data: 1971–2007, average summer/winter temperature: 23.2°C/8.1°C, annual rainfall: 436 mm, annual irrigation: 1′027 mm.
Figure 4
Figure 4. Daily time-course of stomatal conductance (gs).
C+1 leaves (leaf formation: 2010) during a typical early summer day at the irrigated (A) Atocha (10th of June 2011; Tmin = 16.1°C, Tmed = 20.1°C, Tmax = 25.5°C) and non-irrigated (E) Escalonilla (11th of June 2011; Tmin = 16.4°C, Tmed = 20.5°C, Tmax = 26°C) intensive study site (means ± SE, n = 3 trees). The factors site (p>0.0001) and daytime (P<0.003) were significant. Stars indicate a significant difference between the site means (p<0.05) from 9∶00 to 12∶00 am.
Figure 5
Figure 5. Boxplot of the average hourly (CET) O3 concentrations during the vegetation season.
Data from April to September in Atocha for the years 2003–2007. The grey zone outlines the range of values exceeding the population warning threshold (box: interquartile range; whiskers: lower and upper quartiles; median horizontal line of boxes: median; white squares: maxima and minima).
Figure 6
Figure 6. Daily (ppb•h, black spikes) and cumulated (ppm•h, grey line) AOT40 in Atocha from 2003 to 2007.
Yearly AOT40 (April to September) in 2003/2004/2005/2006/2007 amounted to 14.55/11.26/9.0/13.45/7.55 ppm⋅h.
Figure 7
Figure 7. Mean percentage ± SE of leaf area showing adaxial stippling in holm oaks.
Samples from Atocha in June 2007 (n = 4 branches per tree each with leaf age C+0, C+1, C+2, C+3). Different letters indicate significantly different percentages of symptomatic leaf area (p≤0.05).
Figure 8
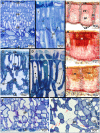
Figure 8. Structural and histochemical changes in the leaf blade.
Leaf age/formation C+0/2007, (G, H) and C+1/2006 (AF, I). Symptomatic (C, D, F, H, I) versus asymptomatic (A, B, E, G) foliar samples. Leaf parts with stipples in symptomatic versus asymptomatic (C versus A) material showed discrete groups of necrotic and collapsed palisade parenchyma (PP) cells surrounded by degenerating mesophyll tissue. At cell level (D versus B), necrotic cells showed cell wall thickening (arrowheads), cracking (*) and folding and a disrupted cell content. The intercellular space contained cellular remains (cr). Degenerating cells showed thickened cell walls, enlarged vacuoles (v) filled with phenolics (vp) and smaller and condensed chloroplasts (ch). Within the spongy parenchyma, cell wall protrusions (red arrows), the frequency of which increased in symptomatic versus asymptomatic material (F versus E), were indicative of oxidative stress in the apoplast. GI Photo-oxidative stress in stipples (st) of symptomatic (H, I) versus asymptomatic (G) samples was shown by gradients of condensed tannin reacting with acid-vanillin (red staining) between the upper (stronger staining) and lower (weaker staining) mesophyll cell layers. In older samples (C+1, I) and in contrast to younger symptomatic samples (C+0, H), stronger oxidation of proanthocyanidins in stipples was shown by the weak reaction of condensed tannins to acid-vanillin. UE, LE upper and lower epidermis; Ve: veins; n: nucleus; t: trichomes.
Figure 9
Figure 9. Seasonal variation of stomatal conductance (gs).
C+0, C+1, C+2 and C+3 foliage (leaf formation: 2011, 2010, 2009, 2008, respectively) at the irrigated (Atocha, grey bars) versus non- irrigated (Escalonilla, white bars) intensive study site in 2011 (means ± SE, n = 3 trees). The monthly irrigation supply at Atocha is shown in Figure 2, the significance of influencing factors in Table 2.
Figure 10
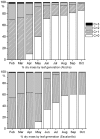
Figure 10. Monthly changes in the foliage biomass fraction (expressed in %) of each leaf generation.
Leaf age/formation C+0/2011, C+1/2010, C+2/2009, C+3/2008 within holm oaks from the irrigated (Atocha) and non-irrigated (Escalonilla) intensive study site in 2011 (mean values of 3 trees).

References

    1. Paoletti E (2006) Impact of ozone on Mediterranean forests: A review. Environ Pollut 144: 463–474. - PubMed
    1. Sanz MJ, Sanz F, Sanchez-Peña G (2001) Spatial and annual temporal distribution of ozone concentrations in the Madrid basin using passive samplers. Scientific World J 1: 785. - PMC - PubMed
    1. EEA (2003) Air pollution by ozone in Europe in summer 2003. Overview of exceedances of EC ozone threshold values during the summer season April- August 2003 and comparisons with previous years. Copenhagen: European Environment Agency Topic report No 3/2003.
    1. EEA (2005) Air pollution by ozone in Europe in summer 2004. Overview of exceedances of EC ozone threshold values for April–September 2004. Copenhagen: European Environment Agency Technical report No 3/2005.
    1. EEA (2006) Air pollution by ozone in Europe in summer 2005. Overview of exceedances of EC ozone threshold values for April–September 2005. Copenhagen: European Environment Agency Technical report No 3/2006.

Publication types