. 2013 Jul 24;8(7):e69465.
doi: 10.1371/journal.pone.0069465. Print 2013.

Japanese encephalitis virus disrupts cell-cell junctions and affects the epithelial permeability barrier functions

Affiliations

Japanese encephalitis virus disrupts cell-cell junctions and affects the epithelial permeability barrier functions

Tanvi Agrawal et al. PLoS One. .

Abstract

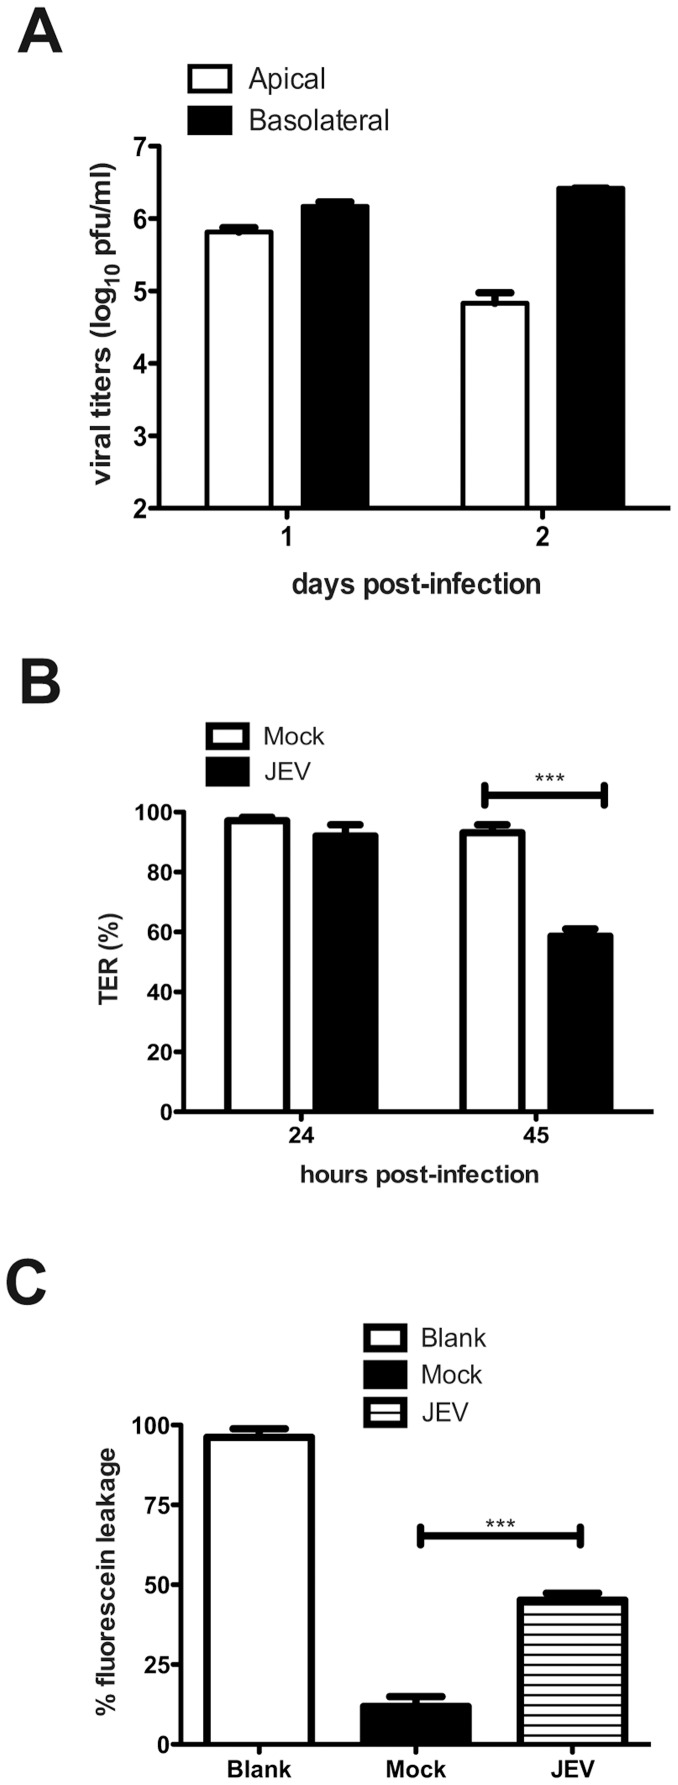
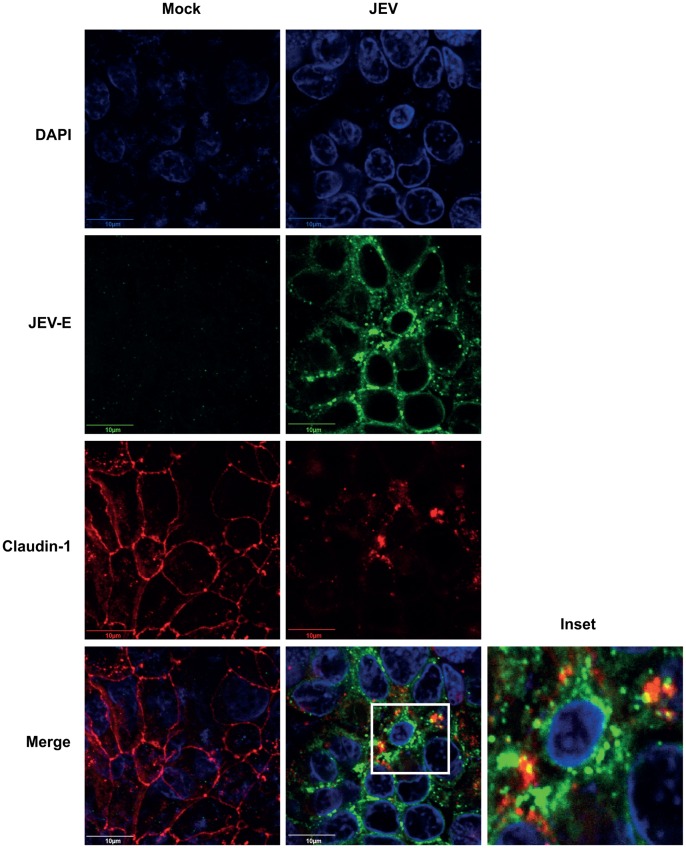
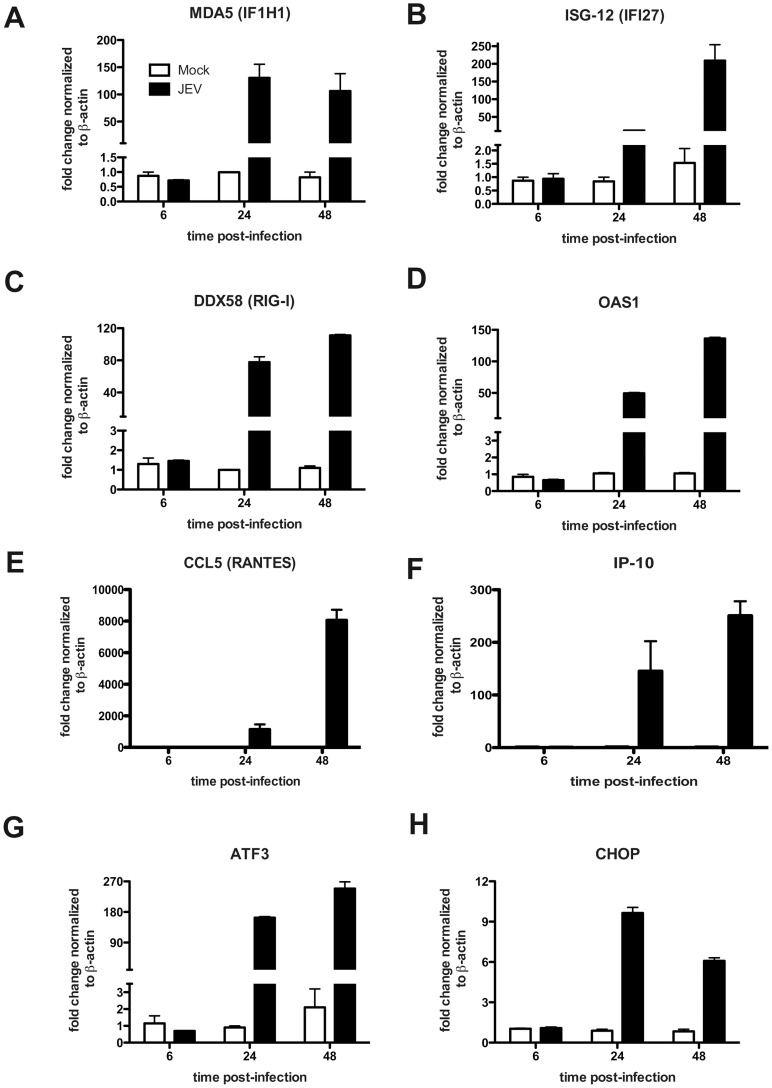
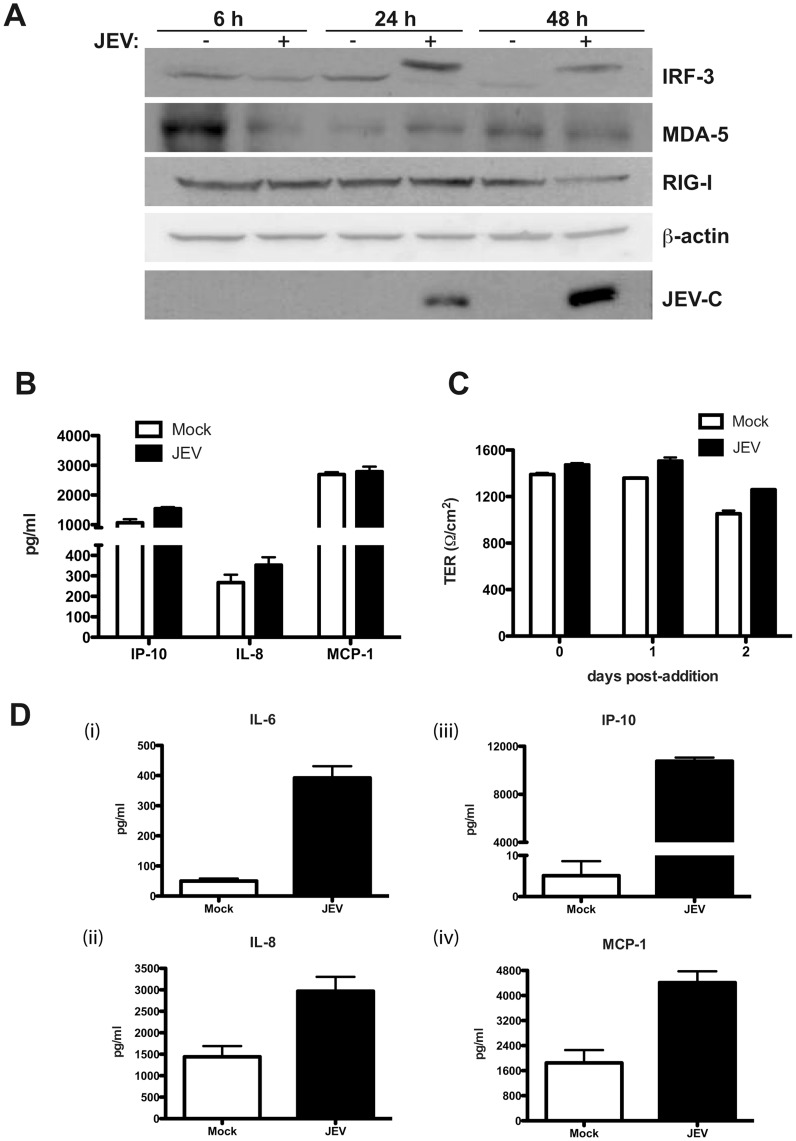
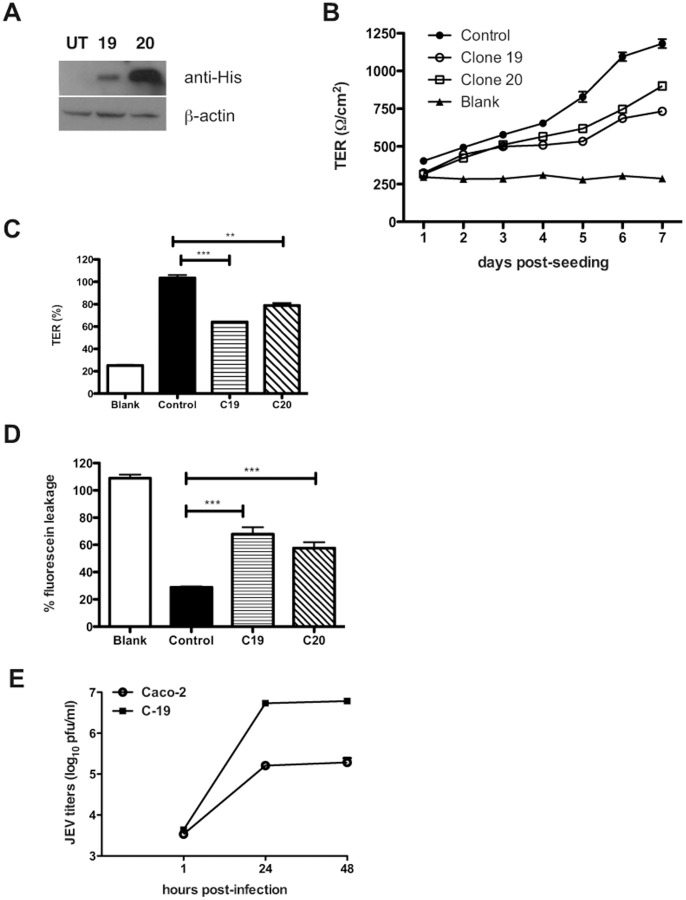
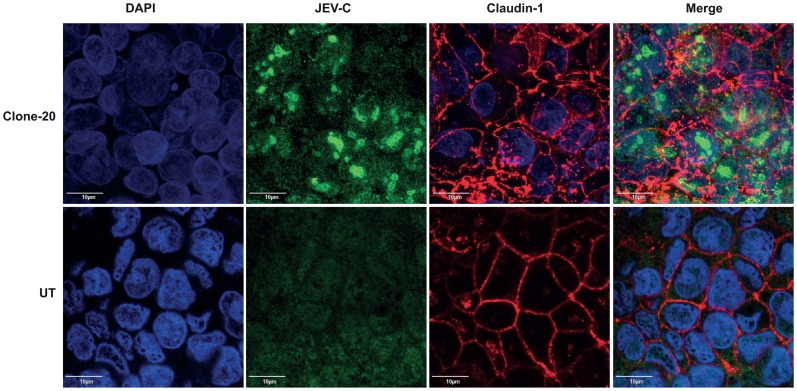
Japanese encephalitis virus (JEV) is a neurotropic flavivirus, which causes viral encephalitis leading to death in about 20-30% of severely-infected people. Although JEV is known to be a neurotropic virus its replication in non-neuronal cells in peripheral tissues is likely to play a key role in viral dissemination and pathogenesis. We have investigated the effect of JEV infection on cellular junctions in a number of non-neuronal cells. We show that JEV affects the permeability barrier functions in polarized epithelial cells at later stages of infection. The levels of some of the tight and adherens junction proteins were reduced in epithelial and endothelial cells and also in hepatocytes. Despite the induction of antiviral response, barrier disruption was not mediated by secreted factors from the infected cells. Localization of tight junction protein claudin-1 was severely perturbed in JEV-infected cells and claudin-1 partially colocalized with JEV in intracellular compartments and targeted for lysosomal degradation. Expression of JEV-capsid alone significantly affected the permeability barrier functions in these cells. Our results suggest that JEV infection modulates cellular junctions in non-neuronal cells and compromises the permeability barrier of epithelial and endothelial cells which may play a role in viral dissemination in peripheral tissues.


Conflict of interest statement

Competing Interests: The authors have declared that no competing interests exist.

Figures

Figure 1
Figure 1. JEV infected cells have reduced expression of junctional proteins.
(A) Caco-2 cells were infected with JEV as described in materials and methods and cell lysates were collected at indicated times post-infection and analyzed by western blot analysis for the indicated proteins. (B) Densitometry of western blots of two experiments performed with Caco-2 lysates 48 h p.i. Signal intensity is normalized to β-actin levels from the same blots. Error bars indicate mean with SD. (C) HUVEC cells were infected with JEV as described in materials and methods and cell lysates were collected at indicated times post-infection and analyzed by western blot analysis for the indicated proteins and viral titers determined by plaque assay at the indicated time post-infection is shown. (D) Huh7 cells were infected with JEV or WNV (E) as described in materials and methods and cell lysates were collected at indicated times post-infection and analyzed by western blot analysis for the indicated proteins.
Figure 2
Figure 2. JEV replication and effects on permeability barrier in Caco-2 cells.
(A) Cells grown on trans-well inserts were infected with JEV with an MOI of 5 pfu/cell and viral titers in the apical and basolateral media was measured by plaque assay at the indicated times post-infection. (B) TER was measured from cells grown on trans-wells and infected with JEV as above. (C) JEV infected cells were incubated with soluble fluorescein and the amount of fluorescein passing from apical to basolateral side was measured as described in materials and methods. The figures are representative of three or more experiments performed with three or more replicates. Error bars indicate mean ± s.d. *** p<0.0001 as determined by two-tailed t-test.
Figure 3
Figure 3. Inhibition of JEV replication blocks permeability barrier disruption.
(A) Cells grown on trans-well inserts were infected with JEV with an MOI of 5 pfu/cell and treated with 20 µM Bisp-W at 1 h post-infection. Viral titer in the apical and basolateral media was measured by plaque assay after two days post-infection. (B) TER was measured from cells grown on trans-wells and infected and treated as above.
Figure 4
Figure 4. JEV infection alters the localization of claudin-1.
Caco-2 cells grown on trans-wells were infected with JEV and at 42 h p.i. cells were fixed and stained for JEV and claudin-1 as described in materials and methods. Marked area in the merge image is shown separately to demonstrate the colocalization of claudin-1 and JEV-E.
Figure 5
Figure 5. JEV infection induces antiviral and cellular stress response genes.
Caco-2 cells were infected with JEV and total RNA was prepared from cells at indicated times post-infection. mRNA levels of indicated genes was quantitated by real time PCR as described in materials and methods. GAPDH or β-actin mRNA levels were quantitated in parallel for normalization. The figures are representative of two experiments performed with three replicates. Error bars indicate mean ± s.d.
Figure 6
Figure 6. JEV mediated disruption of tight junctions is independent of secreted factors.
(A) Caco-2 cells were infected with JEV and cells were collected at indicated time points for preparation of cell lysates. Induction/activation of the indicated proteins was detected by western blot analysis. β-actin serves as loading control and JEV infection is indicated by the expression of capsid protein (JEV-C). (B) The amount of indicated cytokines in infected culture supernatants were measured by Luminex bead assays as described in materials and methods. The figures are representative of three experiments performed with two or more replicates. Error bars indicate mean ± s.d. (C) Clarified supernatants from JEV-infected cells were added onto naïve caco-2 cells grown on trans-wells and TER levels were monitored for indicated periods. The figures are representative of three experiments performed with two or more replicates. Error bars indicate mean ± s.d. (D) The amount of indicated cytokines in infected culture supernatants of HUVECs were measured by Luminex bead assays at 48 h pi as described in materials and methods. Error bars indicate mean with SEM of three replicates.
Figure 7
Figure 7. Effect of inhibitors on claudin-1 degradation.
(A) Caco-2 cells were infected with JEV and at the indicated times post-infection, cells were incubated with carboxy-H2DCFDA and the amount of fluorescent 2′,7′-dichlorofluorescein produced was detected by FACS as a measure of ROS production as described in materials and methods. (B) Cells were mock- or JEV-infected and at 23 h p.i. incubated in growth medium containing: 1) Untreated 2) DMSO (equal volume) 3) 20 µM Z-VAD (OMe)-FMK (4) 50 µM MG-132 (5) 0.5 mM L-NMMA (6) 10 µM DPI (7) 200 nM bafilomycin A1. Cell lysates were prepared 24 h post-addition of the compounds and the levels of claudin-1 was detected by western blot analysis. β-actin was also detected as a control for equal loading. (C) Densitometry of western blots of two experiments performed with lysates prepared from caco-2 cells mock-infected or infected with JEV and treated with DMSO or L-NMMA or bafilomycin A1. Signal intensity is normalized to actin levels from the same blots. Error bars indicate mean with SEM.
Figure 8
Figure 8. JEV capsid alone alters permeability barrier functions.
(A) Lysates were prepared from two caco-2 clones expressing JEV-C and analyzed by western blot for expression of JEV-C (anti-His antibody) or β-actin. (B) TER was measured in caco-2 capsid clones grown on trans-wells as described above. (C) % TER levels in the indicated cells at day 7 post-seeding is shown. (D) Control or JEV-C caco-2 clones were incubated with soluble fluorescein and the amount of fluorescein passing from apical to basolateral side was measured as described in materials and methods. (E) Caco-2 and capsid clone-19 cells were infected with JEV (5 pfu/cell) and supernatants were collected at indicated time post-infection. Viral titer in the supernatant was measured by plaque assay. The figures are representative of two experiments performed with three replicates. Error bars indicate mean ± s.d. *** p<0.0001 and ** p<0.002 as determined by two-tailed t-test.
Figure 9
Figure 9. JEV-C expression alters the localization of claudin-1.
Caco-2-C cells grown on trans-wells were fixed and stained for JEV-C (anti-His-Green) and claudin-1 (Red) as described in materials and methods.

References

    1. Medigeshi GR (2011) Mosquito-borne flaviviruses: overview of viral life-cycle and host‚Äìvirus interactions. Future Virology 6: 1075–1089.
    1. Mishra MK, Dutta K, Saheb SK, Basu A (2009) Understanding the molecular mechanism of blood-brain barrier damage in an experimental model of Japanese encephalitis: correlation with minocycline administration as a therapeutic agent. Neurochem Int 55: 717–723. - PubMed
    1. Swarup V, Ghosh J, Duseja R, Ghosh S, Basu A (2007) Japanese encephalitis virus infection decrease endogenous IL-10 production: correlation with microglial activation and neuronal death. Neurosci Lett 420: 144–149. - PubMed
    1. Huang CH, Wong C (1963) Relation of the peripheral multiplication of Japanese B encephalitis virus to the pathogenesis of the infection in mice. Acta Virol 7: 322–330.
    1. Mathur A, Arora KL, Chaturvedi UC (1981) Congenital infection of mice with Japanese encephalitis virus. Infect Immun 34: 26–29. - PMC - PubMed

Publication types

MeSH terms

LinkOut - more resources