. 2013 Jul 22;8(7):e69560.
doi: 10.1371/journal.pone.0069560. Print 2013.

CD24 expression identifies teratogen-sensitive fetal neural stem cell subpopulations: evidence from developmental ethanol exposure and orthotopic cell transfer models

Affiliations

CD24 expression identifies teratogen-sensitive fetal neural stem cell subpopulations: evidence from developmental ethanol exposure and orthotopic cell transfer models

Joseph D Tingling et al. PLoS One. .

Abstract

Background: Ethanol is a potent teratogen. Its adverse neural effects are partly mediated by disrupting fetal neurogenesis. The teratogenic process is poorly understood, and vulnerable neurogenic stages have not been identified. Identifying these is a prerequisite for therapeutic interventions to mitigate effects of teratogen exposures.

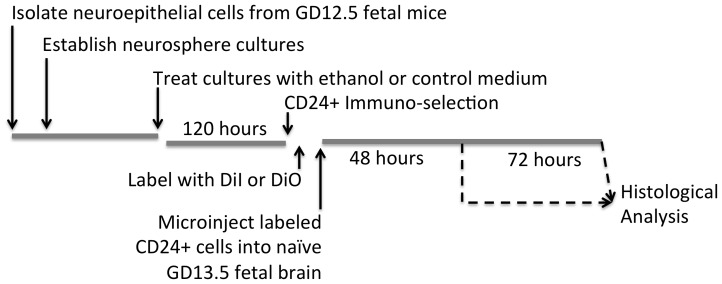
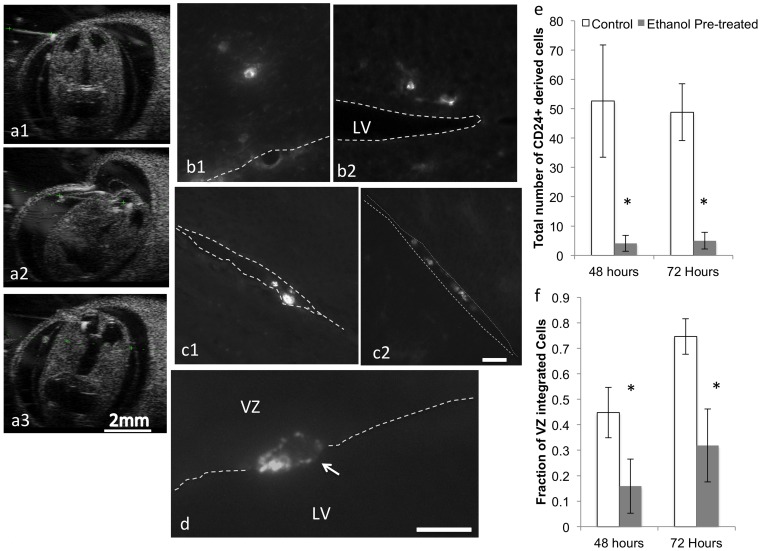
Methods: We used flow cytometry and qRT-PCR to screen fetal mouse-derived neurosphere cultures for ethanol-sensitive neural stem cell (NSC) subpopulations, to study NSC renewal and differentiation. The identity of vulnerable NSC populations was validated in vivo, using a maternal ethanol exposure model. Finally, the effect of ethanol exposure on the ability of vulnerable NSC subpopulations to integrate into the fetal neurogenic environment was assessed following ultrasound guided, adoptive transfer.

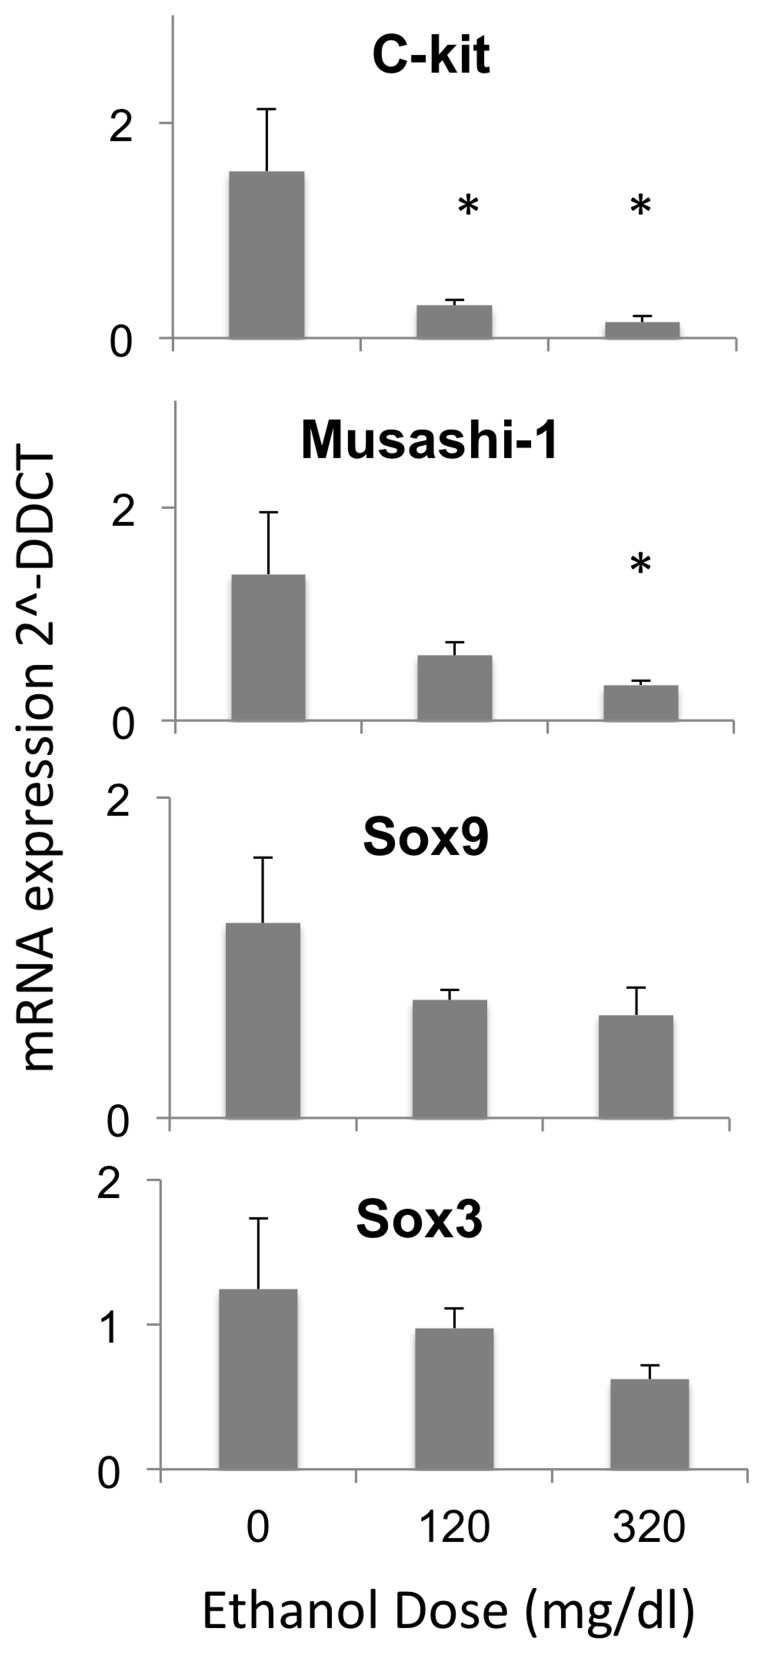
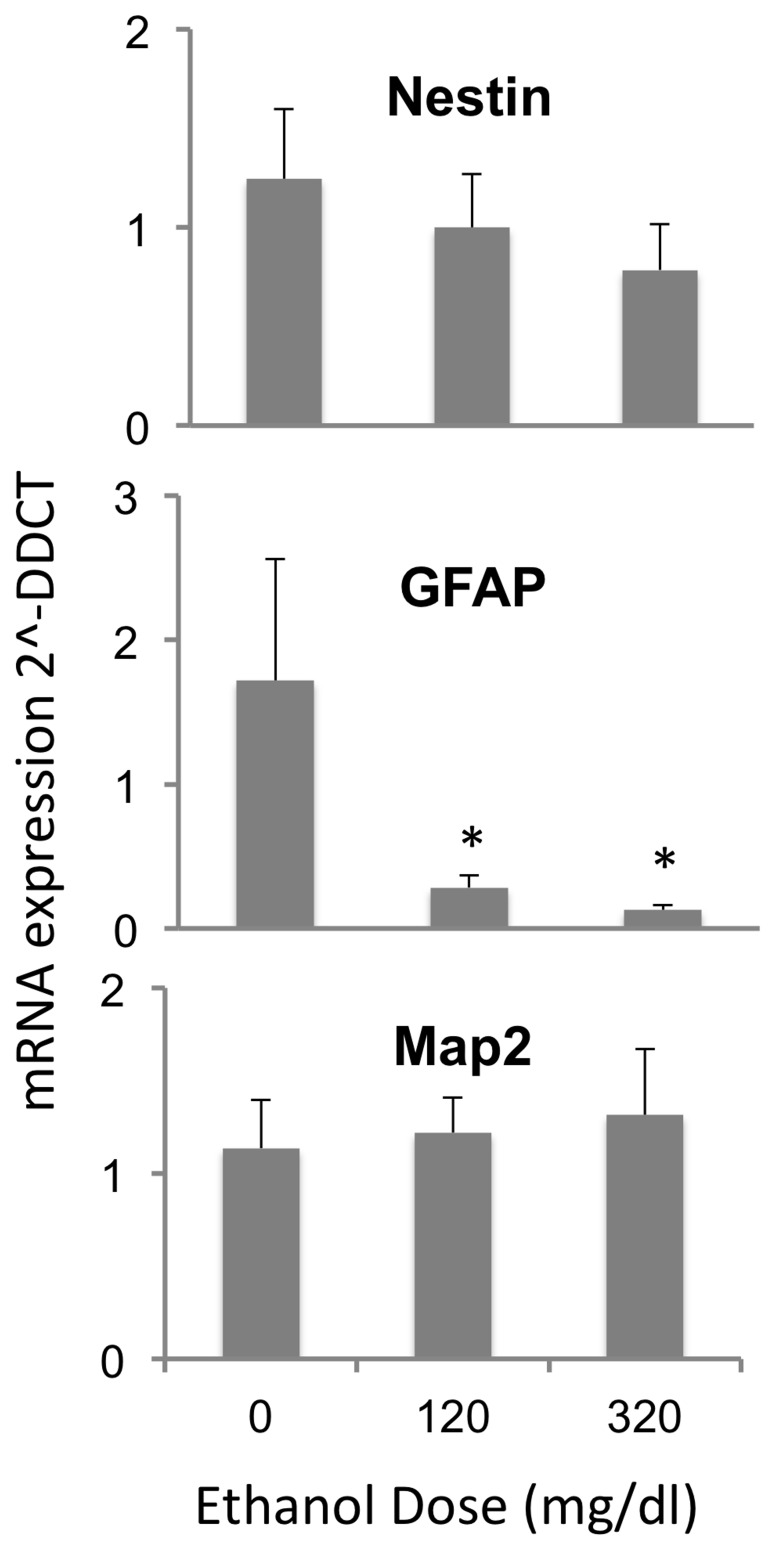
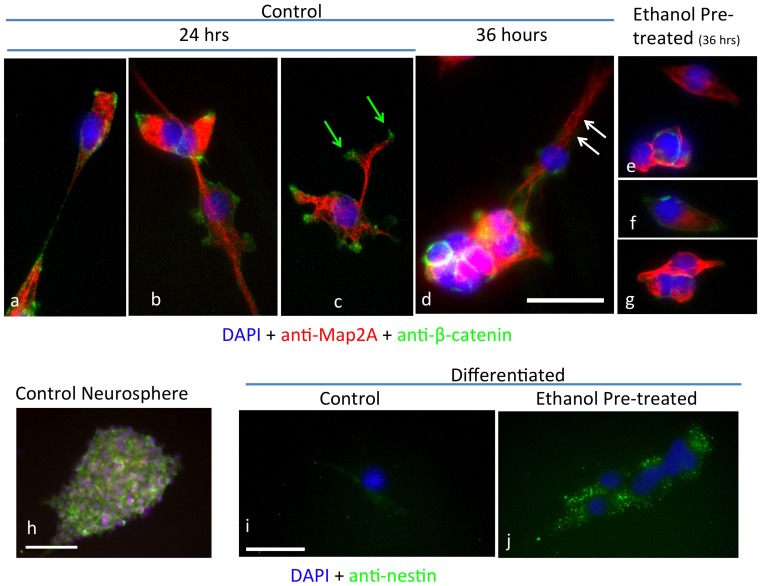
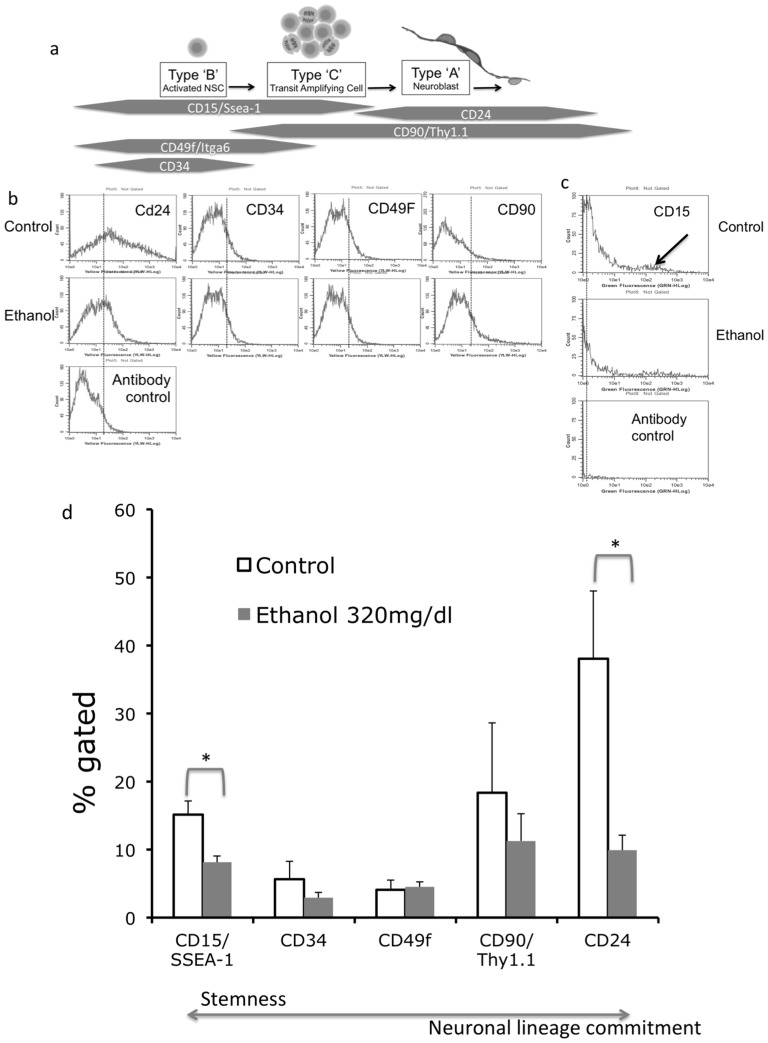
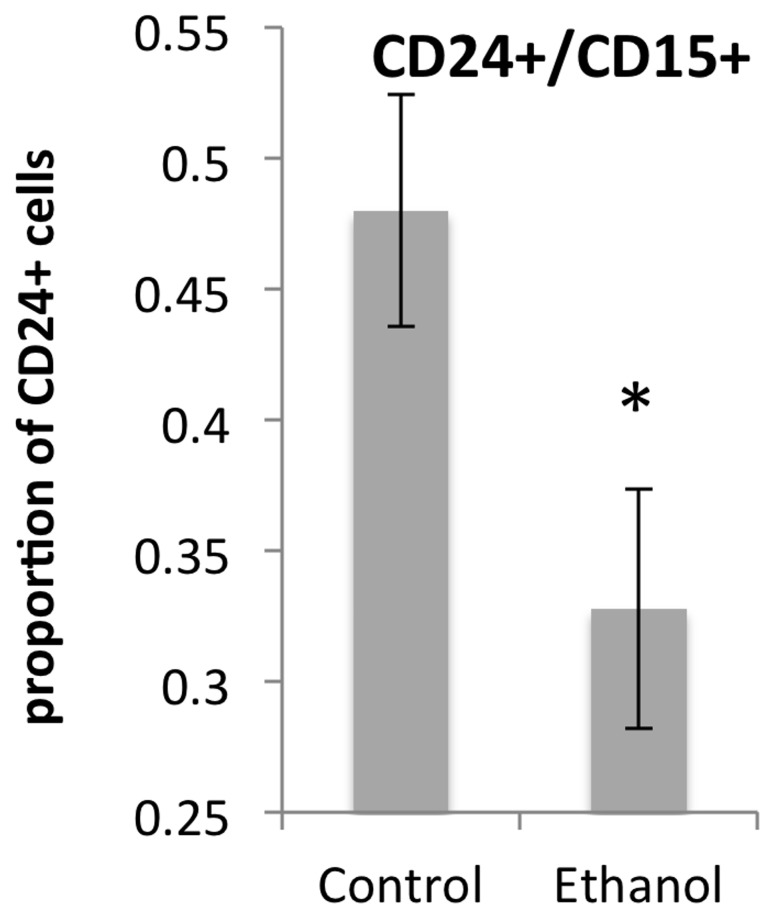
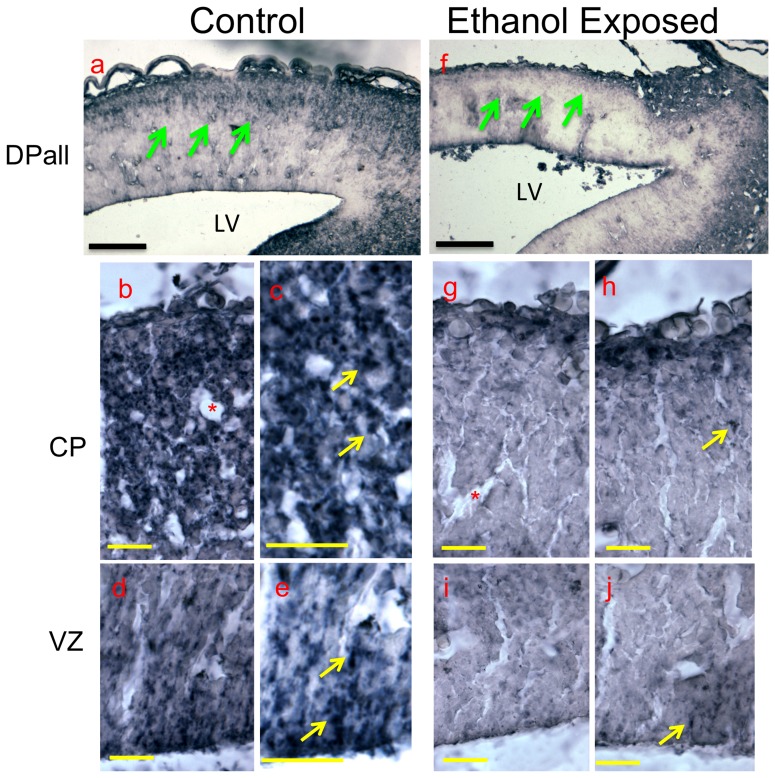
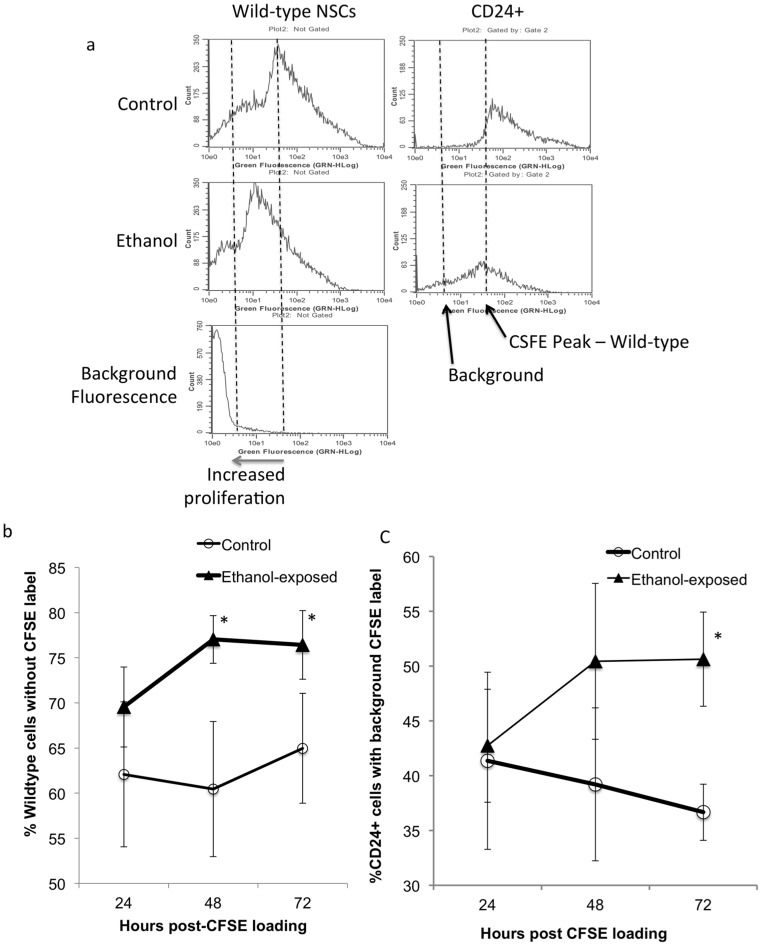
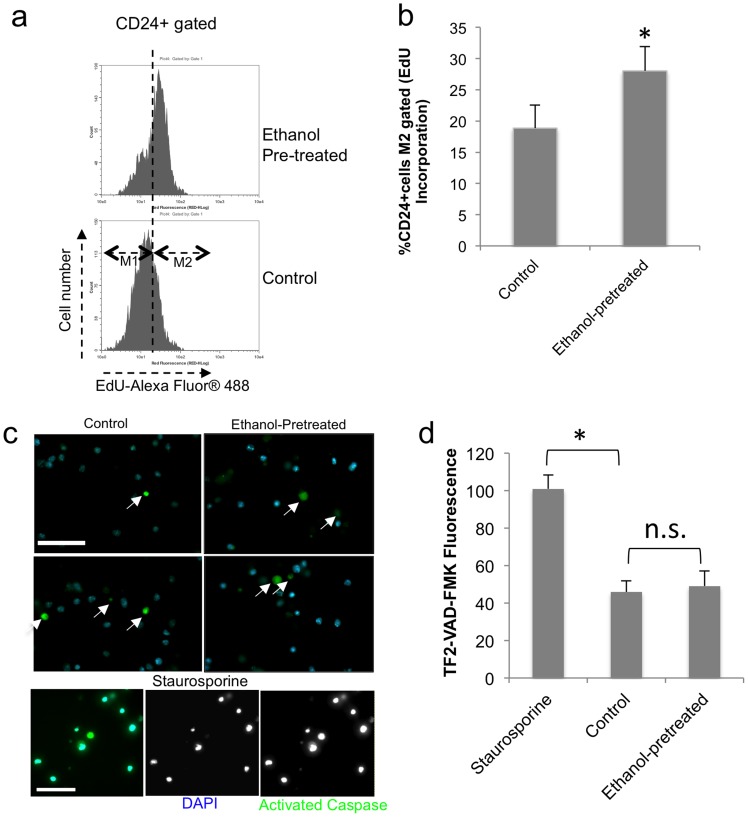
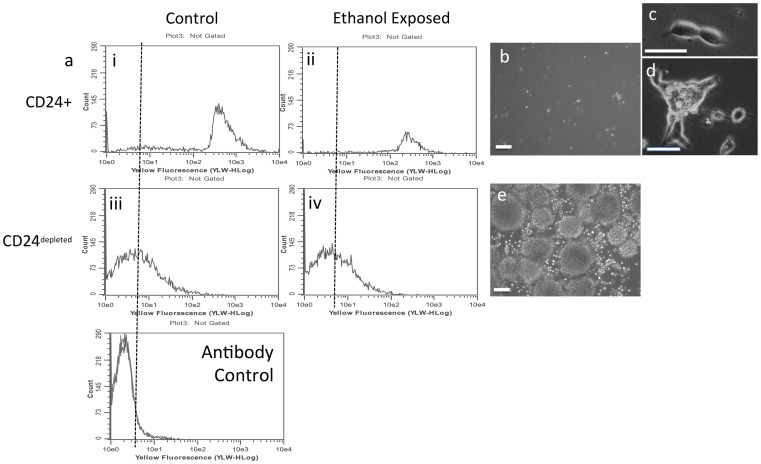
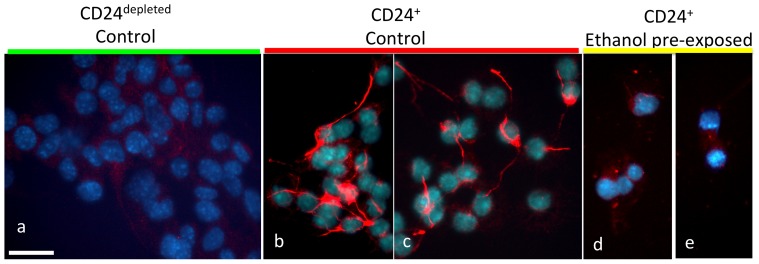
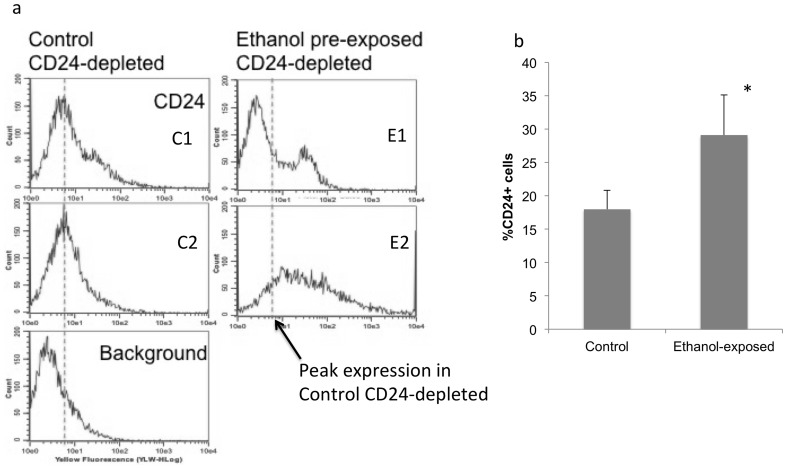
Results: Ethanol decreased NSC mRNAs for c-kit, Musashi-1and GFAP. The CD24(+) NSC population, specifically the CD24(+)CD15(+) double-positive subpopulation, was selectively decreased by ethanol. Maternal ethanol exposure also resulted in decreased fetal forebrain CD24 expression. Ethanol pre-exposed CD24(+) cells exhibited increased proliferation, and deficits in cell-autonomous and cue-directed neuronal differentiation, and following orthotopic transplantation into naïve fetuses, were unable to integrate into neurogenic niches. CD24(depleted) cells retained neurosphere regeneration capacity, but following ethanol exposure, generated increased numbers of CD24(+) cells relative to controls.

Conclusions: Neuronal lineage committed CD24(+) cells exhibit specific vulnerability, and ethanol exposure persistently impairs this population's cell-autonomous differentiation capacity. CD24(+) cells may additionally serve as quorum sensors within neurogenic niches; their loss, leading to compensatory NSC activation, perhaps depleting renewal capacity. These data collectively advance a mechanistic hypothesis for teratogenesis leading to microencephaly.


Conflict of interest statement

Competing Interests: The authors have declared that no competing interests exist.

Figures

Figure 1
Figure 1. Ethanol effects on stem cell mRNAs.
QRT-PCR analysis of mRNA expression of stem cell markers, expressed as fold-change relative to the mean of control, in control and ethanol treated mouse neurosphere cultures showing a general ethanol-related decrease in stem cell mRNAs and significant decline in c-Kit and Musashi-1 mRNA. Asterisks indicate statistically significant differences relative to controls.
Figure 2
Figure 2. Ethanol effects on mRNA transcripts for cytoskeletal proteins.
QRT-PCR analysis of mRNA expression for lineage-specific intermediate filament and microtubule-associated proteins, showing a statistically significant decrease in the expression of GFAP mRNA with ethanol exposure. Asterisks indicate statistically significant differences relative to controls.
Figure 3
Figure 3. Ethanol effects on neural differentiation.
Photomicrographs of immunofluorescence analysis for markers of differentiation in control and ethanol exposed cultures, counterstained with DAPI (blue fluorescence) to visualize nuclei. (a–g) Neurosphere cultures were treated with control medium (a–d) or 320 mg/dl ethanol (e–g) for 5 days, then differentiated in the absence of ethanol, on a laminin-coated substrate with the mitogen withdrawal paradigm (see methods). Cells cultured under control conditions express neuritis that fasciculate to form bundles (white arrows) and express Map2a/b and β-catenin (d, green arrows) immunofluorescence indicative of dendritogenesis. Cells obtained from ethanol pre-exposed neurosphere cultures express Map2a/b immunofluorescence but do not exhibit β-catenin immunofluorescence or evidence for dendritogenesis. (h) Sample neurosphere expressing nestin immunofluorescence (green) counterstained with DAPI. (i–j) Following exposure to control (i) or ethanol-containing medium (j) and differentiation induced by mitogen withdrawal, differentiating control cultures exhibit near undetectable levels of nestin immunofluorescence (green), while differentiating cells pre-exposed to ethanol continue to express nestin immunofluorescent puncta, suggesting the presence of de-polymerized nestin. Scale bars, a–g, 50 µm; h, 50 um; i–j, 50 µm.
Figure 4
Figure 4. Expression and regulation of cell-surface markers.
(a) Schematic diagram showing the stages of the progression of neural stem cells and their relation to the cell surface molecular map used in flow cytometric analysis. (b–c) Sample flow cytometric histograms for stem CD24, CD34, CD49f and CD90 (b), and CD15 (c, arrow identifies the CD15High population), in control and ethanol-treated (320 mg/dl) cultures. ‘X’ axis indicates fluorescence intensity while ‘Y’ axis indicates cell number. The histogram in the bottom panel in ‘b’ and ‘c’ indicates background immunofluorescence visualized by staining with an isotype-specific antibody, used to gate specific labeling (vertical dashed lines). (d) Quantification of flow cytometric data shows that ethanol significantly decreased the numbers of cells specifically labeled with CD24 or CD15. Asterisks indicate statistically significant differences relative to controls.
Figure 5
Figure 5. CD24+CD15+ double-positive cells are specific teratogen targets.
Ethanol exposure results in a significant decrease in the proportion of CD24+ cells that also express CD15 (the CD24+CD15+ double-positive subpopulation). Asterisks indicate statistically significant differences relative to controls.
Figure 6
Figure 6. Telencephalic CD24 expression following in utero ethanol exposure.
Photomicrographs showing the immuno-histochemical localization of anti-CD24 antibody immunoreactivity in tissue sections obtained from control and ethanol-exposed fetal brains. Brain sections from fetuses obtained from timed pregnant mice exposed to ethanol by intragastric gavage exhibited loss of forebrain CD24 expression compared to controls (f vs. a, green arrows). (b–e) Higher magnification micrographs of the control dorsal pallium/isocortex (b,c) and ventricular zone (d,e) show that CD24-immunoreactivity is localized to distinct peri-cellular puncta (yellow arrows), as expected for a cell adhesion molecule. Corresponding sections from ethanol exposed fetuses (g–j respectively), show loss of CD24 immunoreactivity in ethanol exposed fetuses. Asterisks show lumens of blood vessels. Scale bars, a,f, 500 µm; be,gj, 25 µm. Abbreviations, DPall, dorsal Pallium; LV, lateral ventricle; CP, Cortical Plate; VZ, Ventricular zone.
Figure 7
Figure 7. Proliferation of CD24+ cells.
(a) Flow cytometric histograms, of CFSE-labeled cells showing proliferation following ethanol exposure. Control and ethanol treated cultures were labeled with CFSE and cultured for an additional period of up to 72 hours in the absence of ethanol. CFSE permanently labels cells and the label is diluted by successive cycles of cell proliferation, leading to a left shift in intensity. Cells were immunolabeled for CD24 and the number of cells at background staining for CSFE was quantified in all cells (left panels) and in CD24-labeled cells (right panels) as a measure of label dilution and consequently, proliferation. ‘X’-axis denotes CFSE fluorescence intensity and ‘Y’-axis denotes cell number. Histogram in bottom left panel shows background fluorescence. (b,c) Quantitative analysis shows that over a 72-hour period, both wild-type and CD24-gated ethanol-pretreated cells exhibit increased proliferation compared to controls. Asterisks indicate statistically significant differences relative to controls.
Figure 8
Figure 8. DNA synthesis and apoptosis in CD24+ cells.
(a,b) Flow cytometric analysis of CD24-gated cells shows that ethanol pre-exposure results in significantly increased incorporation of the nucleic acid analog EdU 24 hours later: (a) depicts sample CD-24 gated histograms of control and ethanol pre-exposed exposed cultures, (b) shows quantification of percentage of EdU-positive cells (M2 gate). (c,d) Activated Caspase assay shows that ethanol pre-exposure does not lead to a significant change in apoptosis 24 hours later: (c) depicts Caspase-activated cells (green fluorescence) with DAPI (blue) as a counter-stain for nuclei. A majority of staurosporine-treated cells were apoptotic (arrows), whereas only an occasional cell was apoptotic in both the control and ethanol-pretreated conditions. (d) Fluorometric quantification shows that control and ethanol-pretreated cells do not exhibit a significant difference in caspase activity, and that both conditions exhibit less apoptosis than staurosporine treatment. Asterisk indicates statistical significance, n.s., not significant.
Figure 9
Figure 9. Characterization of immuno-magnetically selected CD24+ and CD24depleted populations.
(a) Flow cytometric frequency histogram of CD24+ (top panel) and CD24depleted (middle panel) cells immuno-magnetically selected from control and ethanol-exposed cultures. ‘X’-axis shows CD24 fluorescence intensity and ‘Y’-axis shows cell number. Bottom panel shows background labeling with isotype-specific control antibody. (b–e) Photomicrographs of control CD24+ and CD24depleted cells maintained for seven days in mitogenic medium (b,c) show that CD24+ cells do not form neurospheres in culture (b) but do undergo mitosis (c) and form small adherent cell colonies (d), whereas CD24depleted cells form large neurospheres (e). Scale bar, b,e, 100 µm; c,d, 50 µm.
Figure 10
Figure 10. Ethanol prevents CD24+ cell differentiation.
Photomicrographs of Map2a/b immuno-labeled control CD24depleted (a) compared to control (b,c) and ethanol-pretreated (d,e) CD24+ immuno-magnetically isolated cells following mitogen-withdrawal induced differentiation. Cells are counterstained with DAPI (blue fluorescence) to visualize nuclei. Control, CD24depleted cells do not undergo morphological transformation and exhibit near undetectable levels of Map2a/b immunofluorescence, showing that they are not committed to the neuronal lineage following mitogen withdrawal. Compared to control CD24+ cells, ethanol pre-treated CD24+ cells exhibited decreased neurite outgrowth and little Map2a/b immunofluorescence suggesting that they were resistant to mitogen withdrawal-induced, i.e., cell-autonomous differentiation. Scale bar, a–e, 25 µm.
Figure 11
Figure 11. Time-line.
Schematic of the time-line for the experimental protocol for ultrasound-guided, trans-uterine microinjection of immuno-magnetically isolated CD24+ cells.
Figure 12
Figure 12. In utero orthotopic CD24+ cell transfer.
(a1-a3) Sequential series of Ultrasound images showing trajectory of microcapillary injection of CD24+ cells into the lateral ventricles of GD13 mice showing pre-injection (a1), insertion (a2) and dilation of lateral ventricles (a3), confirming infusion of cells. Sample photomicrographs of control (b12) and ethanol pre-exposed (c1–3) CD24+ cells microinjected into a naïve GD13 fetal brain. Control immuno-magnetically isolated CD24+ cells integrate into the ventricular zone (VZ) after trans-uterine ultrasound guided microinjection, whereas ethanol pre-treated cells localize preferentially to the ventricles (c12, ventricles are delineated by white dashed lines) or adhere to the apical region of the VZ (d). (e,f) Quantitative analysis shows that total number of surviving (e) and integrated (f) CD24+ cells is significantly decreased in the ethanol pre-exposure condition compared to controls. Asterisks indicate statistically significant differences relative to controls. Scale bar, b-c, 50 µm.
Figure 13
Figure 13. Ethanol effects on the CD24depleted population.
Immuno-magnetically selected CD24depleted subpopulation cultured under mitogenic conditions, re-expresses CD24+ cells. (a) Flow cytometric frequency histogram showing the expression of CD24+ cells derived from control (left panel) and ethanol pre-treated CD24depleted cells. ‘X’-axis shows CD24 immunofluorescence intensity and ‘Y’-axis indicates cell number. Bottom panel shows background immunofluorescence following labeling with an isotype-specific antibody. Vertical dashed lines show peak CD24 immunofluorescence in control cells. Sample histograms, and quantitative analysis (b) show variable, but significantly increased numbers of CD24+ cells derived from ethanol pretreated, CD24depleted cells relative to controls. Asterisks indicate statistically significant differences relative to controls.

Similar articles

Cited by

References

    1. Bale TL, Baram TZ, Brown AS, Goldstein JM, Insel TR, et al. (2010) Early life programming and neurodevelopmental disorders. Biol Psychiatry 68: 314–319. - PMC - PubMed
    1. Riley EP, Infante MA, Warren KR (2011) Fetal alcohol spectrum disorders: an overview. Neuropsychol Rev 21: 73–80. - PMC - PubMed
    1. Mattson SN, Crocker N, Nguyen TT (2011) Fetal alcohol spectrum disorders: neuropsychological and behavioral features. Neuropsychol Rev 21: 81–101. - PMC - PubMed
    1. Lemoine P, Harouseau H, Borteryu JT, Menuet JC (1968) Les enfants des parents alcooliques: Anomalies observees apropos de 127 cas. Ouest Medical 21: 476–482.
    1. Jones KL, Smith DW, Ulleland CN, Streissguth P (1973) Pattern of malformation in offspring of chronic alcoholic mothers. Lancet 1: 1267–1271. - PubMed

Publication types

MeSH terms

LinkOut - more resources